

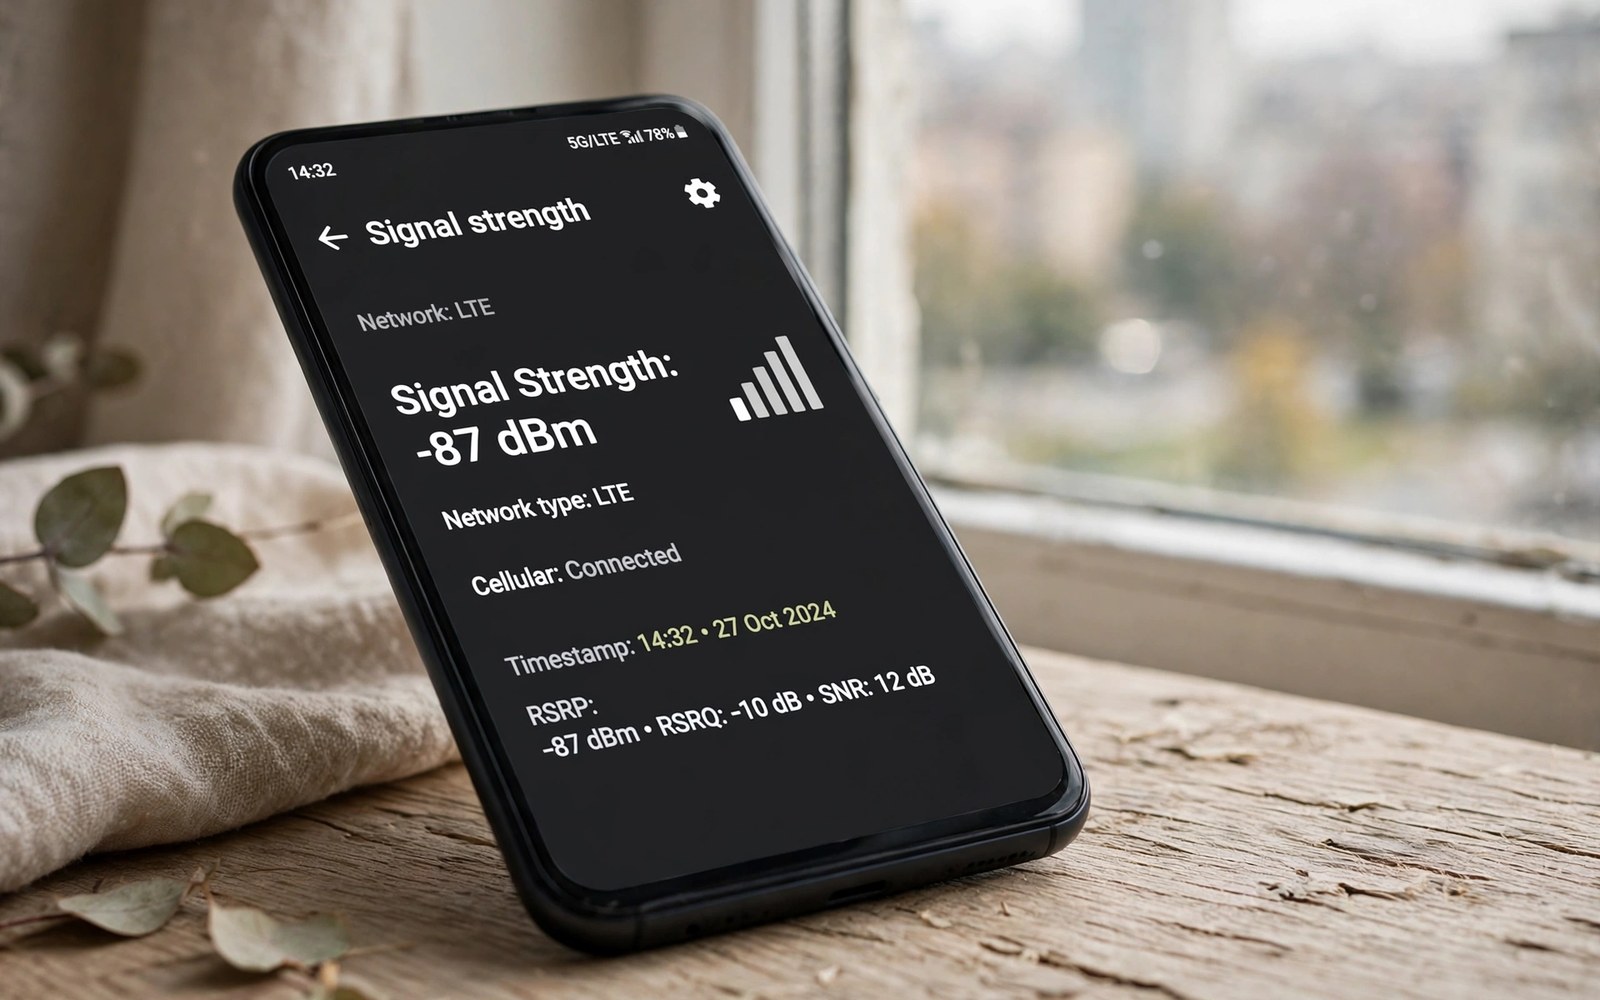
How to Measure Exact Mobile Signal Strength in Real dBm Units
Signal bars hide the truth about mobile reception. A phone with three bars on one brand can show two bars on another brand for the same signal, because each maker defines its own bar thresholds. A dBm value gives an exact measurement that bars cannot, and learning to read it helps you compare rooms and carriers fairly. It also helps you prove a weak spot to support staff instead of arguing about bars.
dBm stands for decibels relative to one milliwatt. Mobile signal values are negative, and a value closer to zero means a stronger signal. A value near minus fifty is excellent, while a reading close to minus one hundred and twenty counts as very weak. Most daily use sits between those extremes, and the difference between minus eighty and minus one hundred is the difference between smooth video and constant buffering.
I started measuring dBm when my phone showed full bars yet calls kept dropping in one corner of my house. The bars said everything was fine. The dBm reading said minus one hundred and fifteen, which is barely usable. Moving two metres toward the window improved the reading to minus ninety, and the drops stopped. Bars never would have told me that.
What dBm actually means
dBm measures received power on a logarithmic scale, so a change of ten dBm means a tenfold change in power. That scale is why small numbers matter: the gap between minus eighty and minus ninety is not a small step, it is a large drop in received power. Bars compress that scale into four or five levels, which hides exactly the information you need when reception is marginal.
Each maker maps dBm to bars differently, and some makers inflate the bars to make reception look better. Two phones side by side can show different bars for the same tower, while their dBm readings agree closely. When you want the truth, read the number and ignore the icon.
The dBm scale from minus fifty to minus one hundred and twenty
Think of the scale in bands. Minus fifty to minus eighty is strong: calls and data work smoothly. Minus eighty to minus one hundred is fair: data works, but video can buffer at the lower end. Below minus one hundred is weak: calls may drop and data may stall. Below minus one hundred and ten, most phones struggle to hold a call at all. Those bands are approximate, and the exact point where trouble starts depends on the network and the phone, but they give you a practical map of the scale.
Why bars lie about your signal
Bars are a marketing decision as much as a measurement. A maker can choose thresholds that show three bars at minus ninety-five, while another maker shows two bars at the same value. Neither is lying in a technical sense, because there is no standard for bars, but the result is that bars cannot be compared between brands. dBm can, because it is a physical unit with a fixed meaning.
dBm versus signal quality: RSRP, RSRQ, and SINR
dBm alone does not tell the whole story. RSRP is the dBm value for the reference signal on LTE and 5G, and it is the number you usually read. RSRQ measures signal quality relative to interference, and SINR measures the ratio of signal to noise. A strong RSRP with a poor SINR can still deliver slow data, because interference drowns the signal. When a reading looks good but data is slow, check SINR next.
Find dBm on your Android phone
Open Settings and tap About Phone. Tap SIM status or Status information, depending on brand, and look for signal strength in dBm. Some phones show dBm for each SIM separately, so note the value for the SIM you use for data. That reading is live, and it updates as the signal changes, so watch it for a few seconds before you write it down.
Use a field test mode on some phones for more detail. Dialer codes for field test vary by brand and carrier, and a field test screen can show the serving cell and neighbour cells alongside the dBm value. Do not change field test settings unless you understand them. Reading values is safe, but changing them can break service, and a wrong setting can take a factory reset to fix.
Settings and SIM status on most brands
On Pixel phones the path is Settings, then About phone, then SIM status. On Samsung phones it is Settings, then About phone, then Status information, then SIM card status. On Xiaomi and OnePlus the path is similar, with the signal strength listed under SIM status. If your brand hides the value, a signal app from a trusted source is the faster route.
Field test menus and dialer codes
Some phones open a field test menu with a dialer code, though the codes vary by brand and many carriers disable them. A field test screen shows more than dBm: it lists the serving cell identity, the frequency band, and the neighbour cells your phone can see. That detail helps you tell whether a weak reading comes from distance, from a blocked band, or from a congested tower.
Signal apps from trusted sources
Install a signal app only from a trusted source if settings do not show dBm. A signal app can display dBm and cell details in one screen, and it can log readings over time. Check app permissions before installing: a signal app needs location permission to show cell details. Remove the app after testing if you do not need it daily, since a background signal app drains battery.
Interpret dBm values correctly
A value from minus fifty to minus eighty is strong, and calls and data should work smoothly in that range. A value from minus eighty to minus one hundred is fair, and data may work but video can buffer at the lower end. A value below minus one hundred is weak, and calls may drop and data may stall in that range. Compare dBm in the same place over time rather than across brands, because different phones have different antennas and scales. A fair comparison uses the same phone in different places.
Note the network type alongside dBm. A strong LTE dBm and a weak 5G dBm are not directly comparable for speed, because 5G can deliver more data at a weaker reading. A stable LTE link can beat a weak 5G link for calls, so judge a link by dBm and stability together. A stable value matters as much as a strong value.
Strong, fair, and weak ranges in practice
In practice, minus seventy is the kind of reading you get standing near a tower or a window with a clear view. Minus ninety is a normal indoor reading in a city. Minus one hundred and five is the point where you start noticing trouble, and minus one hundred and fifteen is the point where you move to another room. Those numbers are guides, not rules, and your phone’s behaviour is the final test.
LTE versus 5G readings
5G readings often look weaker than LTE readings in the same spot, because 5G uses higher frequencies that lose power faster through walls. That does not mean 5G is worse: a 5G link at minus one hundred can still be faster than an LTE link at minus eighty, because the 5G channel is wider. Compare 5G with 5G and LTE with LTE, and let speed tests settle the rest.
Stability matters as much as strength
A reading that jumps between minus eighty-five and minus one hundred and five every few seconds is worse than a steady minus ninety-five, because the phone keeps renegotiating its connection. Watch the value for thirty seconds. A stable reading means a stable link, and a jumping reading means interference or a phone that keeps switching cells.
Measure dBm like a professional
Stand still for thirty seconds before reading dBm. Signal values fluctuate as the phone searches, and a still reading after thirty seconds is more stable than a reading taken while walking. Take three readings and note the middle value, since a middle value avoids a single spike or dip. Test each room in your home with the same method, and note the room, the dBm, and the network type.
A home map of dBm values reveals the best call spot, and sharing that map with family members who use the same carrier saves everyone from dead corners. Test outdoors as a baseline for each home test: an outdoor reading shows the best signal available nearby, and an indoor reading far below outdoor shows building loss. A large indoor loss points to walls or a metal roof, while a small indoor loss points to a distant tower.
The thirty-second still reading
Hold the phone the way you normally hold it, stand still, and wait thirty seconds. The first reading after you move is unreliable, because the phone is still adjusting. After thirty seconds the value settles, and that settled value is the one to record. Repeat the reading twice more and take the middle of the three. That routine takes ninety seconds per spot and gives results you can trust.
Mapping your home with signal readings
Walk through your home and record a reading in each room, using the same routine. Signal mapping turns vague complaints into a concrete map: the kitchen is minus eighty-five, the bedroom is minus one hundred and five, the balcony is minus seventy-five. That map tells you where to take calls, where to place a booster, and whether the problem is the whole house or one room.
Outdoor baseline for every home test
Always take an outdoor reading before you test indoors. If the outdoor reading is minus ninety-five, the tower is far away and no room will be strong. If the outdoor reading is minus seventy and the indoor reading is minus one hundred and ten, the building is blocking the signal, and a window seat or a booster will help far more than a carrier change.
Use dBm to diagnose drops and stalls
Record dBm during a dropped call if you can. A drop at a very weak dBm points to coverage. A drop at a strong dBm points to a tower or account issue, and that distinction changes the fix completely. A drop pattern with dBm values helps support staff, while a vague drop report without dBm is harder to diagnose and slower to resolve.
Record dBm during a data stall too. A stall at weak dBm suggests signal loss. A stall at strong dBm suggests congestion or an app issue. Check other apps during a stall to separate app faults from signal faults: a stall in every app points to the link, while a stall in one app points to that app. Track dBm over a week for a recurring problem, because a week log reveals time patterns. Evening weak values may reflect load rather than signal, and morning strong values may reflect a quiet tower. You can also check the radio state from a computer with the debug bridge while the problem happens: adb shell dumpsys telephony.registry | grep -i -m 5 "mSignalStrength" prints the current signal state, which confirms what the phone sees without touching the screen.
Dropped calls and the dBm at the moment of the drop
Keep a small log: time, place, dBm, and what happened. Three drops at minus one hundred and twelve in the same room is a coverage case. Three drops at minus seventy-five at different places is a network or account case. Support staff can act on the first pattern immediately, and the second pattern tells them to check the account rather than the tower.
Data stalls at strong dBm
A stall at strong dBm usually means congestion, a throttled plan, or an app problem. Test with a speed test app and with a different app at the same moment. If the speed test is fast and one app stalls, the app is the problem. If everything stalls at strong dBm during evening hours, the tower is congested, and the fix is a different time of day or a different carrier.
Tracking dBm over a week
Log readings at the same times each day for a week: morning, midday, and evening. A pattern will emerge. Evening dips point to congestion. Morning strength points to a quiet tower. Random dips at all hours point to interference or a faulty phone. A week of data beats a week of guessing.
What to do with a weak reading
Weak signal fixes start with measurement, and the guide to fixing weak 5G signal uses dBm to choose fixes rather than guessing. A measured weak spot deserves a placement or mode fix: move toward a window, switch the phone to LTE when 5G is weak, or place the phone where the map says the signal is strongest. An unmeasured complaint gives no direction for a fix, so measure first and act second.
When the weak spot is a whole rural area rather than one room, improving reception in deep rural areas covers antennas, boosters, and placement tricks that work when the tower is far away. When the reading jumps between bands, locking a stable network band can stop the phone from switching to a weaker band at the worst moment. Both fixes start from the same measurement, and both are cheaper than replacing the phone.
Placement and mode fixes for weak rooms
Move the phone near a window, away from metal objects, and off the floor. A phone in a pocket reads worse than a phone on a table, because the body absorbs signal. Switch off 5G in a room where 5G is weak and LTE is stable, since a stable LTE link beats a weak 5G link for calls. Those two changes cost nothing and fix a surprising number of weak rooms.
Frequently asked questions
What is a good dBm signal strength?
Minus fifty to minus eighty is excellent, minus eighty to minus ninety is good, minus ninety to minus one hundred is fair, and below minus one hundred is weak. Most daily use happens between minus seventy and minus one hundred. Judge the reading by what the phone does: smooth calls and fast data matter more than the number itself.
Why does my dBm change when I move a few steps?
Radio waves reflect off walls, furniture, and your own body, so moving a few steps can change the reading by ten dBm or more. That is normal. The thirty-second still reading exists precisely because the value moves so much, and the middle of three readings is more trustworthy than any single reading.
Is minus one hundred and ten dBm bad for 5G?
Yes, minus one hundred and ten is weak for any network type, and 5G at that level will struggle with calls and data. Switch to LTE in that spot and compare the readings, since LTE at minus ninety-five will usually work better than 5G at minus one hundred and ten. If both are weak, the problem is coverage, not the network mode.
Can I improve dBm without a booster?
Often, yes. Move toward a window, hold the phone away from your body, remove a thick metal case, and switch to the more stable network mode. Those changes can improve the reading by five to fifteen dBm, which is enough to turn a dropping call into a stable one. A booster helps only when the outdoor reading is already reasonable and the building is the problem.
Start measuring today
Open Settings, find the signal strength in dBm, and take your first reading where you are sitting now. Write it down with the time and the room. Then take a second reading by the nearest window. The difference between those two numbers is the first fact you have ever had about your own reception, and it is worth more than any number of bars.
Build the habit from there: one reading per room, one outdoor baseline, and a small log when something goes wrong. Within a week you will know your home, your commute, and your carrier better than any coverage map can tell you, and you will never argue about bars again.

