

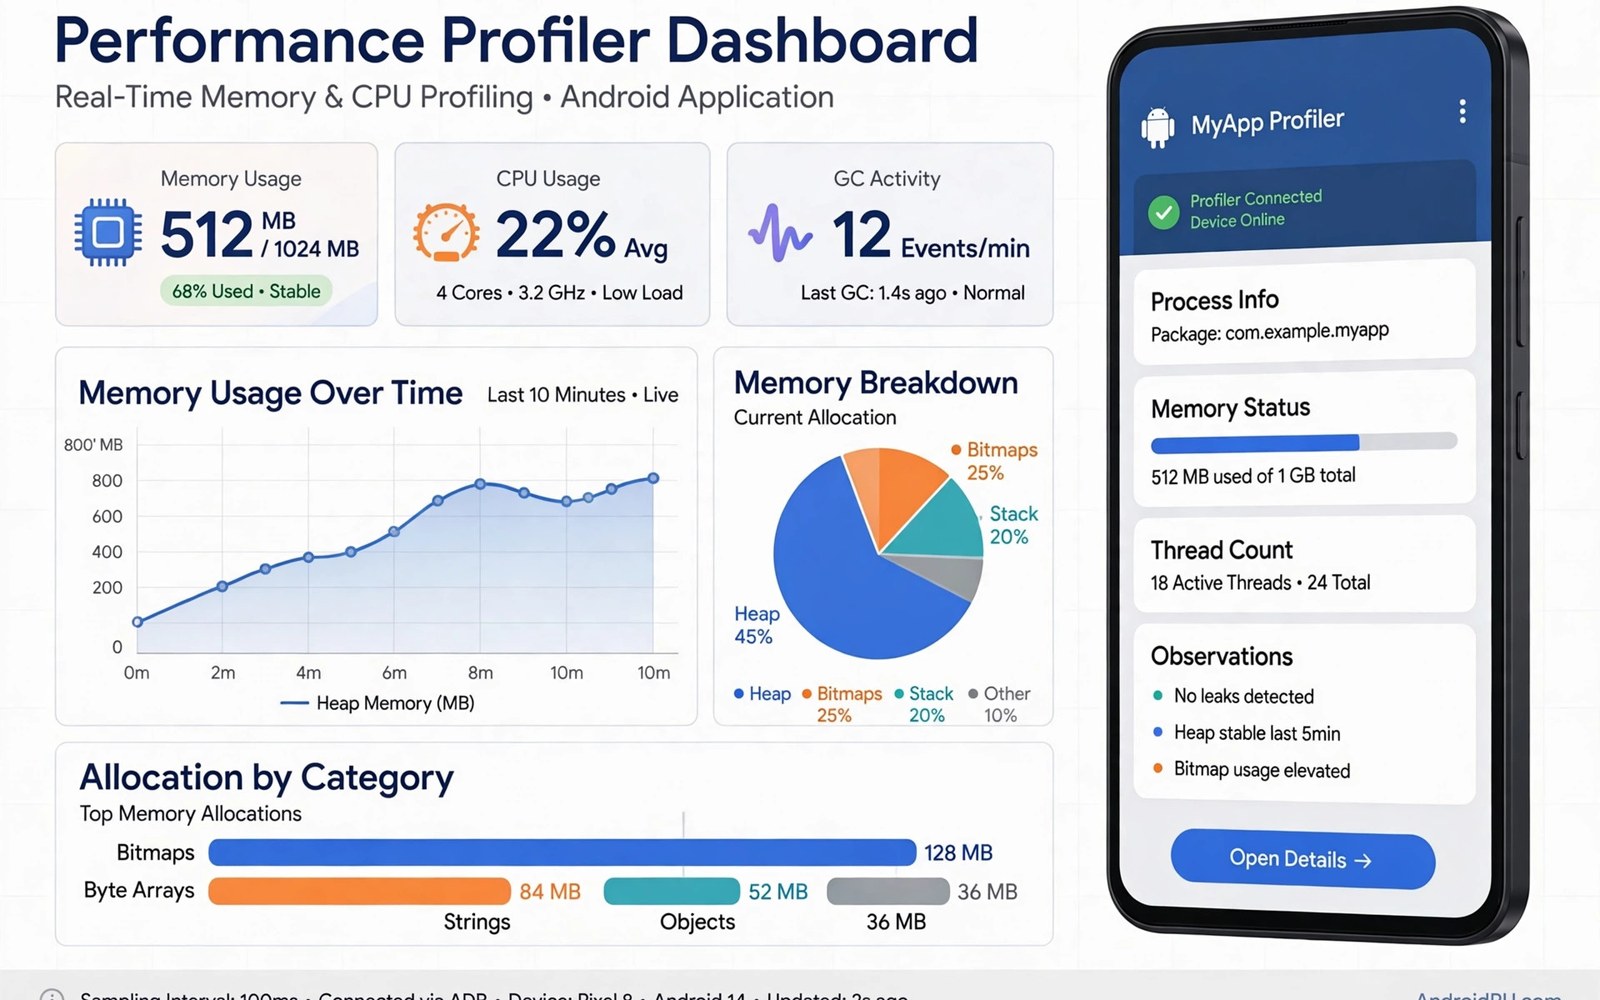
Performance profiling turns vague complaints about a slow app into measurable evidence about memory use and processor work and rendering time that you can actually fix. Android Studio profilers show live graphs for CPU and memory and network and energy while your app runs on a device or an emulator in a realistic scenario. Memory leaks are a common hidden problem because an object that should be released stays reachable through an accidental reference and accumulates over time until the app slows or crashes. Learning to read profiler graphs and heap dumps gives you a systematic way to find leaks instead of guessing which screen or library might be responsible. This guide walks through profiling workflow and leak detection in a practical order for developers at any level.
Start profiling with a clear scenario because random tapping produces noisy data that is hard to compare before and after a fix you intend to measure. Choose a repeatable flow such as opening a list and opening a detail screen and returning to the list several times while watching memory behaviour across repetitions. A healthy app returns to a similar memory baseline after each repetition while a leaking app climbs steadily because each repetition leaves objects behind that never get released. Record baseline measurements before optimisation so you can prove that a change helped rather than relying on a feeling that the app seems faster after editing code. Profiling is a measurement discipline first and a fixing activity second and that order keeps optimisation honest.
Reading CPU and Memory Graphs
The CPU profiler shows method calls and thread activity over time and it helps you find code that runs too often or runs expensive work on the main thread where it blocks interface drawing. Look for spikes that align with user actions such as scrolling or opening a screen because those spikes point to work that should move to a background thread or be cached for reuse. The memory profiler shows heap size and allocations over time and it separates Java heap from native heap and graphics memory so you can tell which area grows during a scenario. A steady climb during repeated actions suggests a leak while a spike that falls after garbage collection suggests temporary allocations that are heavy but not leaking in a permanent way. Learning to distinguish these patterns prevents wasted effort on temporary allocations that the system already handles well.
Recording a CPU trace captures a detailed call stack for a period of activity and you can inspect top down and bottom up views to find hot methods that consume the most time. Flame charts visualise the same data as stacked bars where wide bars represent methods that occupy a large share of total time during the recorded period. Start with the widest bars because optimising a method that uses one percent of time will not change user experience even if the optimisation itself is impressive. Check thread states too because a main thread blocked waiting for a lock or for disk input looks different from a main thread busy with computation and each cause needs a different fix. A careful trace reading habit turns profiling from a guessing game into a repeatable investigation skill.
- Choose a repeatable scenario so measurements stay comparable before and after a fix.
- Watch memory baseline across repetitions to spot steady climbs that signal leaks.
- Start with the widest flame chart bars because they represent the largest time share.
- Separate temporary allocations from permanent leaks by watching post collection behaviour.
- Record baselines before optimisation so improvement is proven with numbers.
Finding Leaks With Heap Dumps
A heap dump captures all objects alive at a moment in time and the profiler can show dominator trees and reference chains that explain why a leaked object remains reachable. Start by forcing garbage collection and then dumping the heap after a repeatable scenario so temporary objects have a chance to be collected before analysis. Search for multiple instances of an activity or fragment that should exist only once because several instances after repeated navigation strongly suggest a leak in that screen. Follow the reference chain from the leaked instance to its GC root and look for a static field or a long lived listener or a background task that holds the screen reference unintentionally. That chain is the clue that tells you exactly which code to change rather than a vague suspicion about a whole screen.
Common leak sources include static references to activities and unregistered listeners and handlers with delayed messages and singletons that store a context from a short lived screen. A singleton should hold an application context when it needs a context at all because an application context lives for the app lifetime and does not leak a single screen. Listeners should be removed in the matching lifecycle callback and delayed messages should be cleared when a screen is destroyed so they do not run after the screen has gone away. Background tasks should use weak references or lifecycle aware scopes when they need to update a screen that may disappear before the task completes. Fixing the root reference is better than adding a workaround that hides the leak for one scenario while leaving it alive for another.
Fixing and Verifying Leaks
Fix a leak by removing the accidental strong reference or by shortening the lifetime of the holder so it matches the lifetime of the object it references in normal use. Replace a static activity reference with a callback interface held weakly or with an event flow that does not retain the screen after navigation. Move listener registration to a lifecycle aware component when possible so registration and removal happen automatically without manual code in every callback. After a fix repeat the exact same scenario and compare heap dumps to confirm that only one instance of the screen remains after repeated navigation. A fix is not complete until measurement confirms it because a code change that looks correct can still leave another reference chain holding the same object alive.
Leak detection libraries can automate this process during development by watching activities and fragments and reporting retained instances after garbage collection with a reference chain. Use such a library in debug builds only because it adds overhead and it should never ship inside a production app that users install from a store. Treat library reports as leads rather than absolute proof because a retained object may still be collected later under different timing conditions in a complex app. Combine automated detection with manual profiler investigation for leaks that automated tools flag repeatedly across many runs. A disciplined verification loop of measure and fix and remeasure builds confidence that performance work actually improves the app for users.
CPU Jank and Rendering Performance
Rendering performance matters because users perceive an app as slow when frames drop even if background work completes quickly in the background. The profiler and frame timing tools show whether the main thread spends too long in layout or drawing during scrolling or animation on a target device. Overdraw and deep view hierarchies increase drawing cost while complex layouts with many nested containers force repeated measurement passes during each frame. Flattening layouts and reusing view holders and avoiding heavy work in drawing code all help maintain a smooth frame rate during scrolling. Test on a low end device as well as a flagship device because performance problems that are invisible on fast hardware become obvious on hardware that many users still use every day.
Network and disk work on the main thread is a classic cause of jank because a single slow read can block drawing for a noticeable period during scrolling. Move such work to background threads with coroutines and cache results so repeated reads do not repeat the same slow operation on every frame. You can study background patterns in coroutines and Flow for background tasks to keep the main thread free for drawing. You can also review lifecycle handling in Android app lifecycle and fragment states because work started at the wrong lifecycle moment often causes jank. Smooth rendering comes from respecting the main thread as a scarce resource reserved for interface work alone.
Building a Profiling Habit
Profile early and often rather than waiting until users complain because early profiling catches leaks when the code is still fresh in your mind and easy to change. Add profiling to your checklist for large features and for any feature that holds images or large lists or long lived listeners that could leak. Keep a short performance note for each release that records baseline memory and startup time so regressions become visible before they reach many users. Share profiler findings with the team in plain language because a graph with a clear before and after comparison convinces colleagues faster than a vague report of slowness. A team that profiles together builds a culture where performance is a feature rather than an afterthought fixed in a panic.
You can strengthen your development environment through setting up Android Studio for beginners when profiler performance itself feels slow on your machine. You can also plan verification with testing Android apps with unit and Espresso tests because automated tests can catch some performance regressions early. Profiling skill grows with practice and each investigation teaches you more about how Android manages memory and threads under real conditions. With a systematic approach you can find and fix leaks confidently and keep your app fast and stable for users over a long lifetime.
A final habit prevents performance regressions because you should capture a memory baseline for your main user flow before each major feature lands in a release branch. That baseline lets you compare the new flow with the old flow under identical conditions and it makes a leak visible before users encounter it in production. Share the before and after graphs in your review so the team can discuss performance as concrete evidence rather than as a vague feeling about speed. With that habit profiling becomes a normal part of feature work rather than an emergency response to user complaints.
// After repeated navigation, check heap for duplicate activities
// Force GC, dump heap, inspect reference chain to GC root
// Fix: remove static reference, unregister listener, clear handler
The steps above follow the approach described in the official developer documentation for this platform and reflect common practice used by experienced developers when they build and test Android apps in a careful and organised way.

