

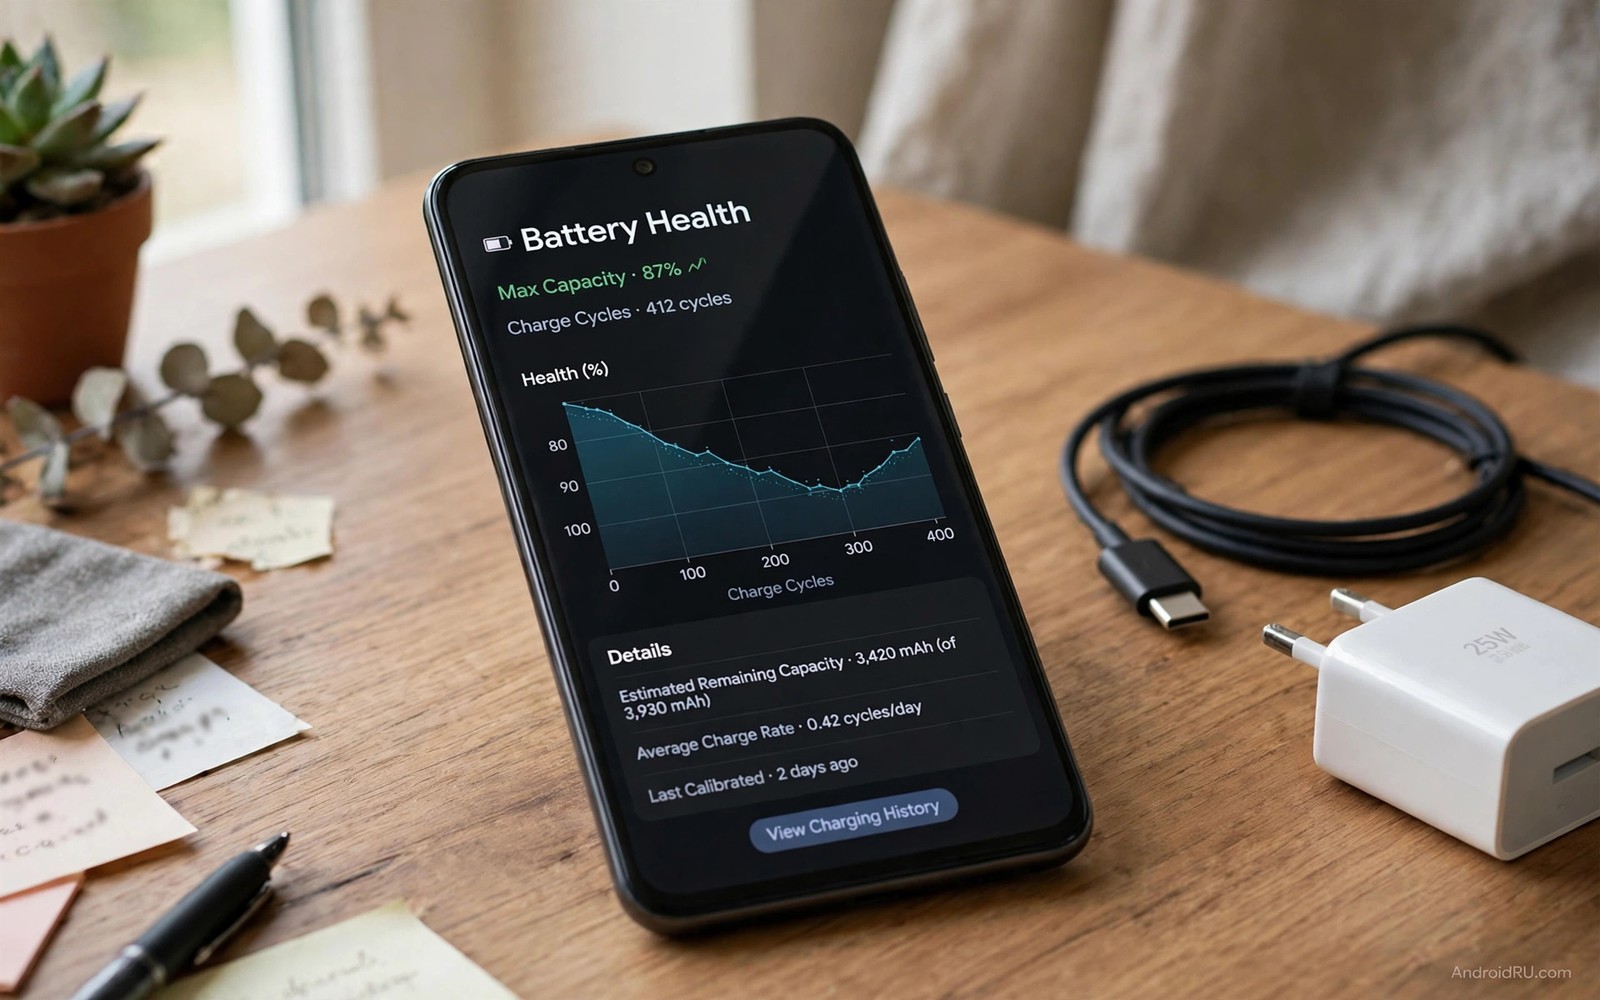
Battery degradation feels mysterious without root access. Owners want a cycle count. They want a capacity percent. They want a trend. Root tools promise exact numbers. Non-root tools seem vague. The truth is more hopeful. Built-in diagnostics and careful logging give a useful picture without root. You can estimate cycles from charge history. You can estimate capacity from runtime trends. You can track degradation over months with a simple log. Exact lab numbers need hardware tools. Practical decisions do not. This guide shows non-root monitoring that supports real decisions. It covers built-in options first. It covers app estimates second. It covers manual logs third. Together they reveal degradation clearly.
What cycles and capacity actually mean
A cycle is a full charge throughput equal to 100 percent of capacity. It is not necessarily one plug session. Two 50 percent top-ups equal one cycle in throughput terms. Partial cycles stress the cell less than full cycles. Cycle count therefore approximates wear but does not define it perfectly. Heat and voltage extremes add wear beyond cycle count. A phone with 500 gentle cycles may be healthier than a phone with 300 harsh cycles. Capacity is the maximum charge a cell can hold now compared with when new. A new cell holds 100 percent of design capacity. An aged cell may hold 85 percent. That 15 percent loss means shorter runtime. It also means faster percent drops. Capacity and cycles together tell the story. Either alone misleads. Track both estimates together.
Degradation is gradual then accelerating. Early loss is slow. A phone may lose 5 percent in year one. It may lose 10 percent in year two. It may lose 15 percent in year three as resistance rises. That acceleration is normal chemistry. It is not a defect. Monitoring catches acceleration early. Early catches allow habit changes before loss becomes severe. A habit change in year two can slow year three loss. A habit change in year four has less remaining capacity to protect. Timing matters. Start monitoring early even if the phone feels new. Early baselines make later trends meaningful. A baseline without later data is useless. A trend without a baseline is guesswork. Record both from today.
Built-in battery reports without root
Many Android phones offer built-in battery health in settings. The location varies by brand. Check Settings and then Battery. Look for Battery Health or Battery Usage details. Some brands show maximum capacity directly. Some show it under device care. Use that number if available. It comes from the battery management chip. That chip tracks cycles and capacity internally. Its estimate is the most accurate non-root source. Note the number quarterly. A stable number means slow degradation. A falling number means faster degradation. Do not check daily. Daily numbers fluctuate with temperature and calibration. Quarterly numbers show trends. Trends guide decisions.
Some phones hide health behind diagnostic codes or support apps. A maker support app may run a battery test. That test discharges and measures under controlled conditions. It gives a health grade. Use it if available. It is safer than third party apps that guess from voltage. Also check Battery Usage history. Usage history shows screen time per charge over weeks. A falling screen time per charge signals capacity loss. It also signals increased drain from apps. Separate those causes by checking background time too. If background time is stable but screen time falls then capacity is likely falling. If background time rises then apps are the cause. That separation is crucial. It prevents blaming the battery for an app problem.
Developer options offer another non-root clue. Enable Developer Options by tapping build number seven times if not already enabled. Look for battery stats or bug report options. A bug report contains detailed battery history. Reading it is technical. It shows charge cycles and voltage over time. Most owners do not need that depth. A simple log gives similar decisions with less effort. Use bug reports only if you enjoy technical detail or need evidence for a warranty claim. Warranty claims benefit from official diagnostics. A maker service centre can run a definitive test. Home logs support the claim. They do not replace official testing for warranty purposes.
App estimates: useful but imperfect
Several battery health apps estimate capacity without root. They work by tracking charge sessions. They compare charge added with percent gained. Over many sessions they estimate full capacity. Their accuracy improves with more sessions. Early estimates may be off by 10 percent. Later estimates after twenty sessions are closer. Use one app consistently. Switching apps resets learning. Keep the same app for months. Note its estimate quarterly. Do not trust a single session estimate. Trust the trend across many sessions. An app that shows a steady decline is likely correct about direction even if absolute numbers are approximate. Direction matters more than exact percent for decisions.
Choose an app with a good privacy record. Battery apps need usage access. That access reveals app use patterns. Choose an app that works offline and does not upload data unnecessarily. Avoid apps that promise battery repair or boosting. Those apps often run background services that drain power. They also make false claims. A monitoring app should only monitor. It should not claim to fix chemistry. It should not run constantly. A good monitoring app wakes during charging to record sessions. It sleeps otherwise. Check its own battery use in settings. A monitoring app that appears at the top of drain charts is a bad monitor. Delete it and try another. Monitoring should not become the drain it measures.
Calibrate app estimates occasionally. Run a full charge from low to full with the app recording. That session gives the app clean endpoints. It improves future estimates. Do this once every few months. Do not do it weekly. Full cycles add wear. Occasional calibration cycles are worth the small wear for better data. Balance data quality against cycle cost. One calibration cycle per quarter is a good trade. More frequent calibration wastes cycles for marginal data improvement. Data should serve decisions. It should not become an obsession that harms the battery it tracks.
A manual cycle and capacity log
A manual log needs no app and no root. Record daily charge sessions in a note. Note start percent and end percent for each session. Sum the percent throughput weekly. Divide by 100 to estimate cycles that week. A week with 700 percent throughput equals roughly seven cycles. That estimate is crude. It is also useful over months. A phone averaging seven cycles weekly will reach 350 cycles yearly. A phone averaging fourteen cycles weekly will reach 700 cycles yearly. Those totals predict degradation speed. High weekly cycles need habit changes. Low weekly cycles predict long life. The log turns vague use into a number. Numbers guide habits.
Track runtime alongside cycles. Note screen on time from full to 20 percent on a typical day. Record that number weekly. A falling screen time trend signals capacity loss or increased drain. Check background time to separate causes. If screen time falls while background stays stable then capacity is falling. If both fall then apps may be draining. That pair of numbers is powerful. It needs only Battery Usage data already on the phone. No app needed. No root needed. Record weekly for three months. A clear trend will emerge. That trend is your degradation monitor. It is also your habit feedback loop. Habits that improve screen time will show in the log within weeks.
Record temperature events in the same log. Note hot days and car heat events. Note fast charging days. Those events explain sudden trend changes. A month with several hot events may show a capacity dip. A month without them may show stability. Correlating events with trends teaches cause and effect. It also motivates heat control. A log without events is just numbers. A log with events is a story. Stories change behaviour. Numbers alone often do not. Write one line per week. Include cycles estimate and screen time and notable heat events. That weekly line is enough for long term monitoring.
Weekly battery log
Week: 2026-10-05 to 2026-10-11
Throughput: 650%  Estimated cycles: 6.5
Screen time full to 20%: 5.4 hours
Heat events: one car sun afternoon
Trend: screen time stable, cycles moderate
The log above follows a simple weekly tracking pattern used by many Android power users to monitor degradation without any paid tool or root access. It records only throughput and screen time and heat events. Those three inputs estimate cycles and capacity and stress. A stable screen time with moderate cycles means healthy aging. A falling screen time with high cycles means faster aging. A falling screen time with low cycles points at heat or app drain. Review the log monthly. Look for trends not single weeks. Single weeks vary with travel and use. Monthly trends reveal true degradation. That discipline beats any single app score.
Interpreting trends and making decisions
Interpret trends with thresholds. A capacity estimate above 85 percent is good. It supports normal use without changes. A capacity between 80 and 85 percent is watchful. It supports normal use with good habits. It may need more frequent charging on heavy days. A capacity below 80 percent is replacement territory. It means runtime is noticeably shorter. It means sudden shutdowns become more likely. Consider replacement if the phone otherwise meets your needs. Consider upgrade if the phone lacks updates or performance. Those thresholds are guidelines. Personal tolerance varies. A light user may tolerate 75 percent capacity fine. A heavy user may need replacement at 85 percent. Judge by your daily experience plus numbers. Numbers plus experience give the best decision.
Cycle count thresholds help too. Most lithium-ion phone cells are rated for 500 to 800 cycles before capacity falls below 80 percent. That rating assumes moderate conditions. Harsh conditions lower it. Gentle conditions raise it. A phone at 400 cycles with 88 percent capacity is aging well. A phone at 400 cycles with 78 percent capacity aged harshly. Investigate harsh factors in the second case. Look for heat events and fast charging overuse. Fix those factors for the next battery. A replacement battery with the same habits will age the same way. Habit change plus replacement breaks the cycle. Monitoring reveals the habit problem before replacement. That revelation is the value of tracking.
Share logs with a repair shop when seeking replacement. A shop can confirm with a hardware test. Your log speeds that confirmation. It also prevents unnecessary replacement when the problem is apps. A shop that sees stable capacity but high background time will advise app fixes first. That advice saves money. A shop that sees falling capacity and high cycles will advise replacement confidently. That confidence comes from your data. Data turns a vague complaint into a diagnosis. Diagnosis leads to correct spending. Correct spending is the goal of monitoring. Monitoring is not an end in itself. It is a tool for decisions.
Common mistakes
Many owners trust a single app reading as exact. App readings estimate with error. Trends matter more than single numbers. Many owners check health daily and panic over fluctuations. Temperature and calibration cause daily variation. Quarterly trends are meaningful. Daily readings are noise. Many owners ignore cycle count and focus only on percent. Percent without cycles misses wear speed. Many owners chase root tools for exact numbers and risk warranty. Non-root trends suffice for decisions. Many owners monitor without acting. A falling trend needs habit change. Monitoring without action wastes effort. Many owners blame capacity for app drain. Check background time before blaming the cell. Drain and degradation look similar in runtime. Their fixes differ completely.
Another mistake is calibrating constantly to improve app estimates. Frequent full cycles add wear for marginal data gain. Calibrate quarterly at most. Another mistake is using a monitoring app that drains heavily. Check the monitor own battery use. Delete a monitor that tops drain charts. Pair monitoring with calibrating the meter for accurate readings and with technician style diagnostic tests. Monitoring plus calibration plus load tests give a complete non-root picture. Any one alone is incomplete. Together they support confident decisions.
FAQ
Can I see exact cycle count without root? Not always exactly. Built-in diagnostics on some phones show it. Other phones require estimation from charge throughput logs. Estimates over months are accurate enough for decisions. Exact lab counts need hardware testing.
How often should I check battery health? Quarterly is enough. Daily checks show noise from temperature and calibration. Quarterly checks show trends. Trends guide replacement and habit decisions.
Does a battery app drain the battery it monitors? A good app uses little power. It records during charging and sleeps otherwise. A bad app runs constantly and appears in drain charts. Delete a monitor that drains noticeably.
Conclusion
Monitoring degradation without root is possible and useful. Use built-in health if your phone offers it. Use one consistent app for estimates if not. Keep a weekly log of charge throughput and screen time. Note heat events alongside numbers. Review trends quarterly. Act on falling trends with habit changes. Consider replacement below 80 percent capacity or when sudden shutdowns become frequent. Start your weekly log today. Note this week throughput and screen time. That first entry becomes the baseline for all future decisions. It also pairs with understanding rapid drops from 20 percent to zero when the meter itself looks unreliable.

