

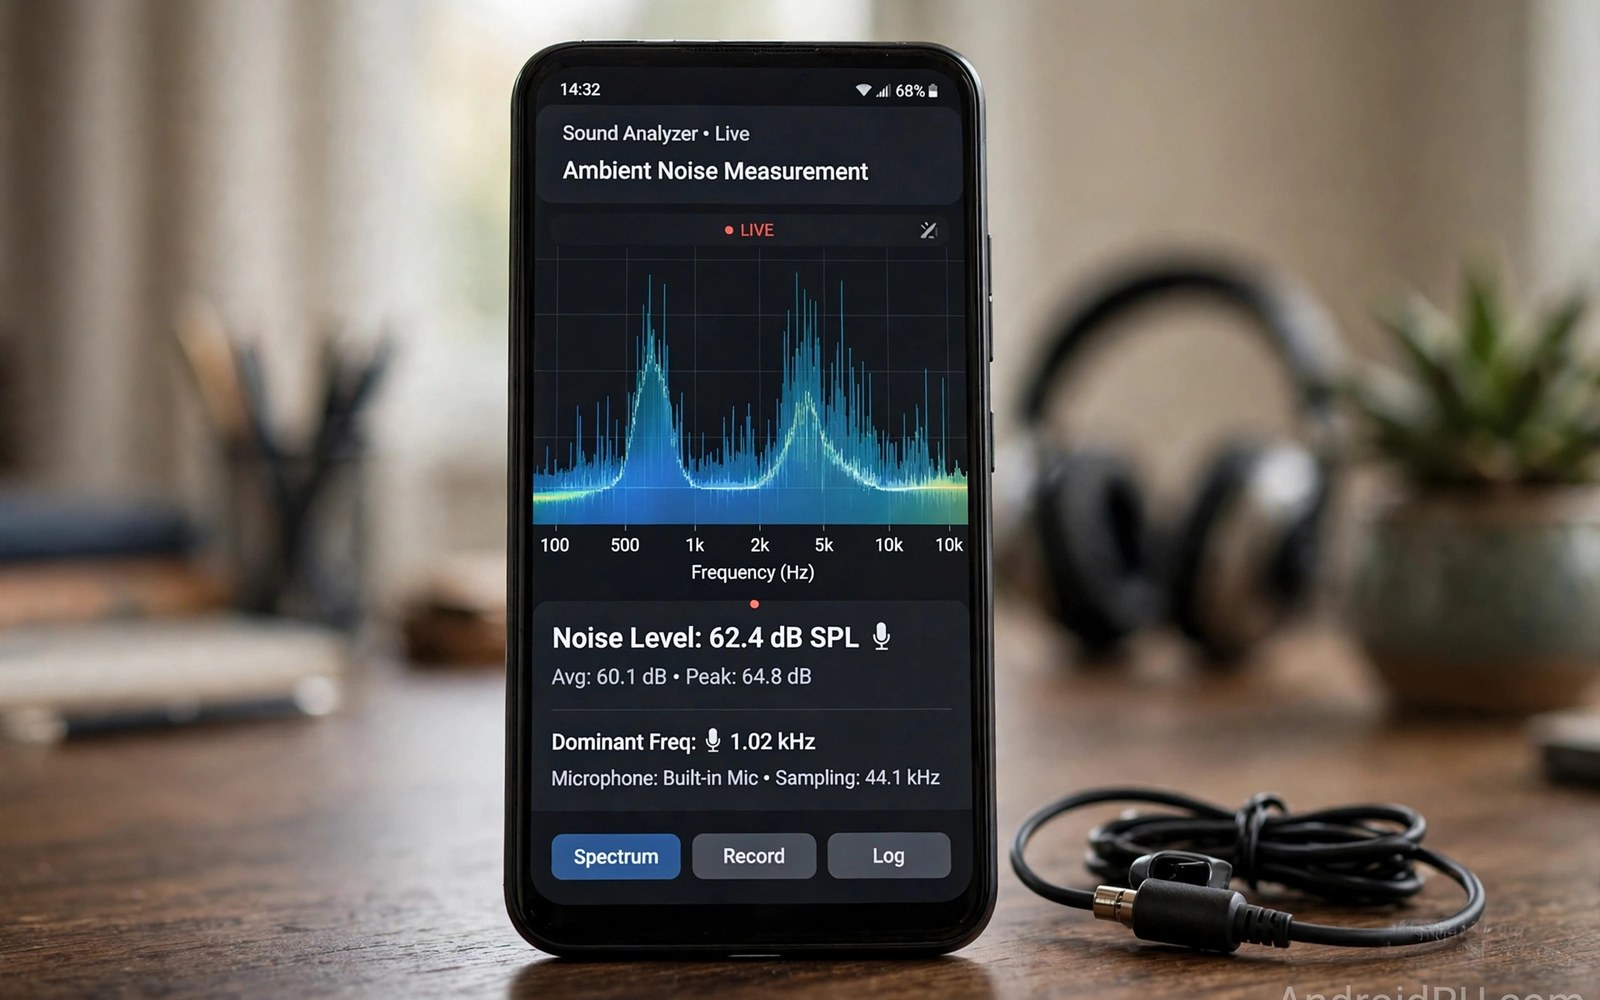
Audio analyzer apps measure sound in numbers instead of impressions. Frequency spectrum and noise level and loudness all appear live on screen. This guide explains how to use audio analyzer apps for sound frequency and noise measurements and how to read their results honestly.
Phone microphones are decent measurement tools with limits. They suit room noise checks and speaker tests well. They cannot match calibrated lab gear. Knowing that limit keeps results useful. If you record screen videos with internal audio then an analyzer also helps you check whether recorded levels clip or sit too low.
Spectrum views and frequency basics
A spectrum shows energy across frequency bands. Low bands cover bass. Mid bands cover voices. High bands cover hiss and detail. A flat spectrum means balanced sound. A peak in one band means that range dominates.
Test speakers with a sweep tone and watch the spectrum follow it. Gaps in the sweep reveal weak ranges. Compare two speakers with the same sweep and same phone position. Position changes results more than small speaker differences do.
Noise level measurement in decibels
Noise meters show loudness in decibels. A quiet room reads near thirty decibels. Normal conversation reads near sixty. A busy street reads near eighty. These numbers help you judge rooms and workplaces objectively.
Hold the phone steady at ear height for room tests. Avoid covering the microphone. Take readings over thirty seconds and note the average. Single second peaks mislead. Average level describes a room far better than one loud moment.
Calibrating expectations for phone microphones
Phone microphones limit low bass and very high treble. They also compress loud sounds to avoid clipping. Absolute decibel readings may sit a few decibels off true values. Relative comparisons stay reliable.
Compare before and after with the same phone. A curtain change or a speaker move shows clearly in relative numbers. Do not compare absolute numbers across different phone models. Each microphone colors results differently.
Room acoustics tests anyone can run
Clap once and watch the decay on a spectrum view. Fast decay means a dead room. Slow decay means echo. Furniture and curtains shorten decay. Bare walls lengthen it. This simple test guides treatment choices cheaply.
Play pink noise through a speaker and walk the room. Level changes reveal dead spots and boomy corners. Move the speaker or add soft material at the worst spot. Retest after each change to confirm improvement.
Hearing safety and daily noise checks
Long exposure above eighty five decibels risks hearing damage. An analyzer warns you when a workplace or concert crosses that line. Use the warning to take breaks or wear protection. Short loud peaks matter less than sustained loud averages.
Check headphone levels too with caution. Phone microphones cannot measure headphone output directly. Judge by listening volume and time. Lower volume for long sessions protects hearing better than any single measurement.
Measuring speaker frequency response
Speaker frequency response shows which ranges a speaker emphasizes. Play a sweep tone and watch the spectrum curve. Peaks show emphasized ranges. Dips show weak ranges. A fairly flat curve suits music best. A mid peak suits voice calls best.
Room reflections shape measured response strongly. Test the same speaker in two rooms and curves differ. Compare speakers in one room only. Position the phone at listening distance. Consistent method beats expensive gear for speaker comparison.
Headphone testing with analyzers
Phone microphones cannot measure headphone output directly. Test headphones by recording their leakage at high volume instead. Leakage readings hint at loudness but not at quality. Judge headphone quality by listening tests primarily.
Use analyzer apps to test the room while wearing headphones. A quiet room reading confirms isolation. High room noise leaking through suggests poor isolation. Isolation matters for focus work. Combine leakage hints with listening judgment for a full picture.
Noise pollution mapping at home
Map home noise by room and by time. Measure each room morning and evening. Note appliances that raise levels sharply. A washing machine or a blender dominates nearby readings. Mapping reveals which rooms suit calls and which suit quiet work.
Share noise maps with family to agree quiet hours. Data settles arguments about loud rooms better than opinions. A bedroom reading above fifty decibels at night deserves action. Curtains and door seals cut noise cheaply. Retest after each change.
Decibel scale intuition for daily life
Decibel intuition helps you act on readings fast. Thirty decibels is a whisper quiet room. Fifty is a calm office. Seventy is a loud vacuum. Ninety is a motorcycle nearby. Each ten decibel rise feels roughly twice as loud.
Learn these anchors and meter readings become meaningful instantly. A reading of sixty during a call is fine. A reading of eighty during work is disruptive. Anchors turn numbers into decisions without consulting charts every time.
When to trust a professional measurement
Professional measurement suits legal disputes and workplace safety certification. Certified meters carry calibration certificates. Phone readings lack that certification. Employers and courts require certified data for formal decisions.
Use phone readings to decide whether professional measurement is worth it. A phone reading near a legal limit justifies hiring a professional. A phone reading far below limits saves that cost. Phones triage and professionals certify.
Frequency weighting and human hearing
Human hearing perceives frequencies unevenly. Mid frequencies sound louder than very low or very high ones at the same energy. Weighting curves adjust meter readings to match perception. A weighted readings reflect what ears actually experience. Unweighted readings reflect raw physical energy instead.
Use weighted readings for comfort and safety judgments. Use unweighted readings for engineering comparisons. Mixing the two confuses results badly. Note which weighting your analyzer uses before comparing numbers. A weighted and an unweighted reading of the same sound differ by several decibels legitimately.
Testing room echo with clap analysis
Clap analysis reveals room echo character quickly. A single sharp clap excites all frequencies at once. The decay curve shows how fast each frequency fades. Fast decay across all bands means a dead room. Slow decay in low bands means boomy bass that lingers. That pattern guides acoustic treatment choices precisely.
Record claps from the listening position for relevant results. Claps near walls emphasize reflections differently than center room claps. Repeat three claps and average the decay curves. Averaging removes single clap variation. Room treatment decisions deserve averaged data rather than one lucky clap.
Outdoor noise measurement challenges
Outdoor measurement faces wind interference directly. Wind across the microphone creates false low frequency noise. Windscreens cut wind noise substantially for outdoor tests. A simple foam cover helps enormously. Without wind protection outdoor readings inflate badly and mislead decisions.
Traffic variation also complicates outdoor averages. Measure over several minutes to average passing vehicles fairly. Note measurement time since rush hour differs from midday calm. Outdoor noise assessment needs longer windows than indoor rooms. Patience produces outdoor data worth acting on.
Analyzer apps for musicians
Musicians use analyzers to tune rooms and instruments. Spectrum views show harmonic balance of an instrument clearly. A guitar with weak harmonics looks different from a full sounding one. Room nodes show as peaks during sustained notes. Musicians adjust position and treatment based on those visible patterns.
Tuning apps overlap with analyzer apps but serve different purposes. Tuners measure one pitch precisely. Analyzers show the whole spectrum at once. Musicians benefit from both tools together. Use tuners for pitch accuracy and analyzers for tone and room quality judgments.
Calibrating phone microphones roughly
Rough microphone calibration uses a reference sound at a known level. Play a tone from a calibrated speaker at a fixed distance. Note the phone reading against the known level. The difference is your phone offset for that frequency range. Apply the offset mentally to later readings for closer accuracy.
Repeat calibration for voice frequencies and for low bass separately. Phone offsets vary by frequency band. A single offset cannot correct every band accurately. Band specific offsets give better corrected readings. Rough calibration beats uncorrected readings for serious room comparisons.
adb shell dumpsys audio | grep -i -m 5 'stream'The command above follows the standard syntax for the Android developer bridge and prints audio stream state so you can compare analyzer readings with system audio routing.
Common mistakes
The biggest mistake is treating phone readings as lab accurate. Phone microphones have limits and offsets. Use readings for comparison and trends. Use calibrated gear for legal or safety certification work.
Another mistake is measuring with the phone in a pocket or hand over the mic. Blocked microphones read low and skew every result. Hold the phone openly at the test position. Repeat readings to confirm stability.
People also chase single peaks instead of averages. A door slam is not room noise. Average over thirty seconds for rooms. A channel scan habit of repeated sampling applies here too since one sample never describes a changing environment.
Frequently asked questions
How accurate are Android noise meters?
Good enough for room comparison and daily awareness. Expect a few decibels of offset from true values. Relative changes with the same phone are reliable. Certified measurements need calibrated equipment.
Can analyzers test my speakers?
Yes with sweep tones and spectrum views. Compare speakers at the same position and volume. Gaps and peaks reveal tuning differences. Room effects shape results so test in the same room.
What noise level is safe for work?
Below seventy decibels average suits long work comfortably. Above eighty five sustained needs protection or breaks. Use average readings over time and not single peaks for safety calls.
Conclusion
Audio analyzer apps turn sound into visible data. Spectrum views reveal frequency balance and meters track room loudness. Use same phone comparisons and average readings for trustworthy results.
Your next step is concrete. Measure your main room for thirty seconds today and note the average. Then test display calibration for a matching visual quality check on the same device.

