

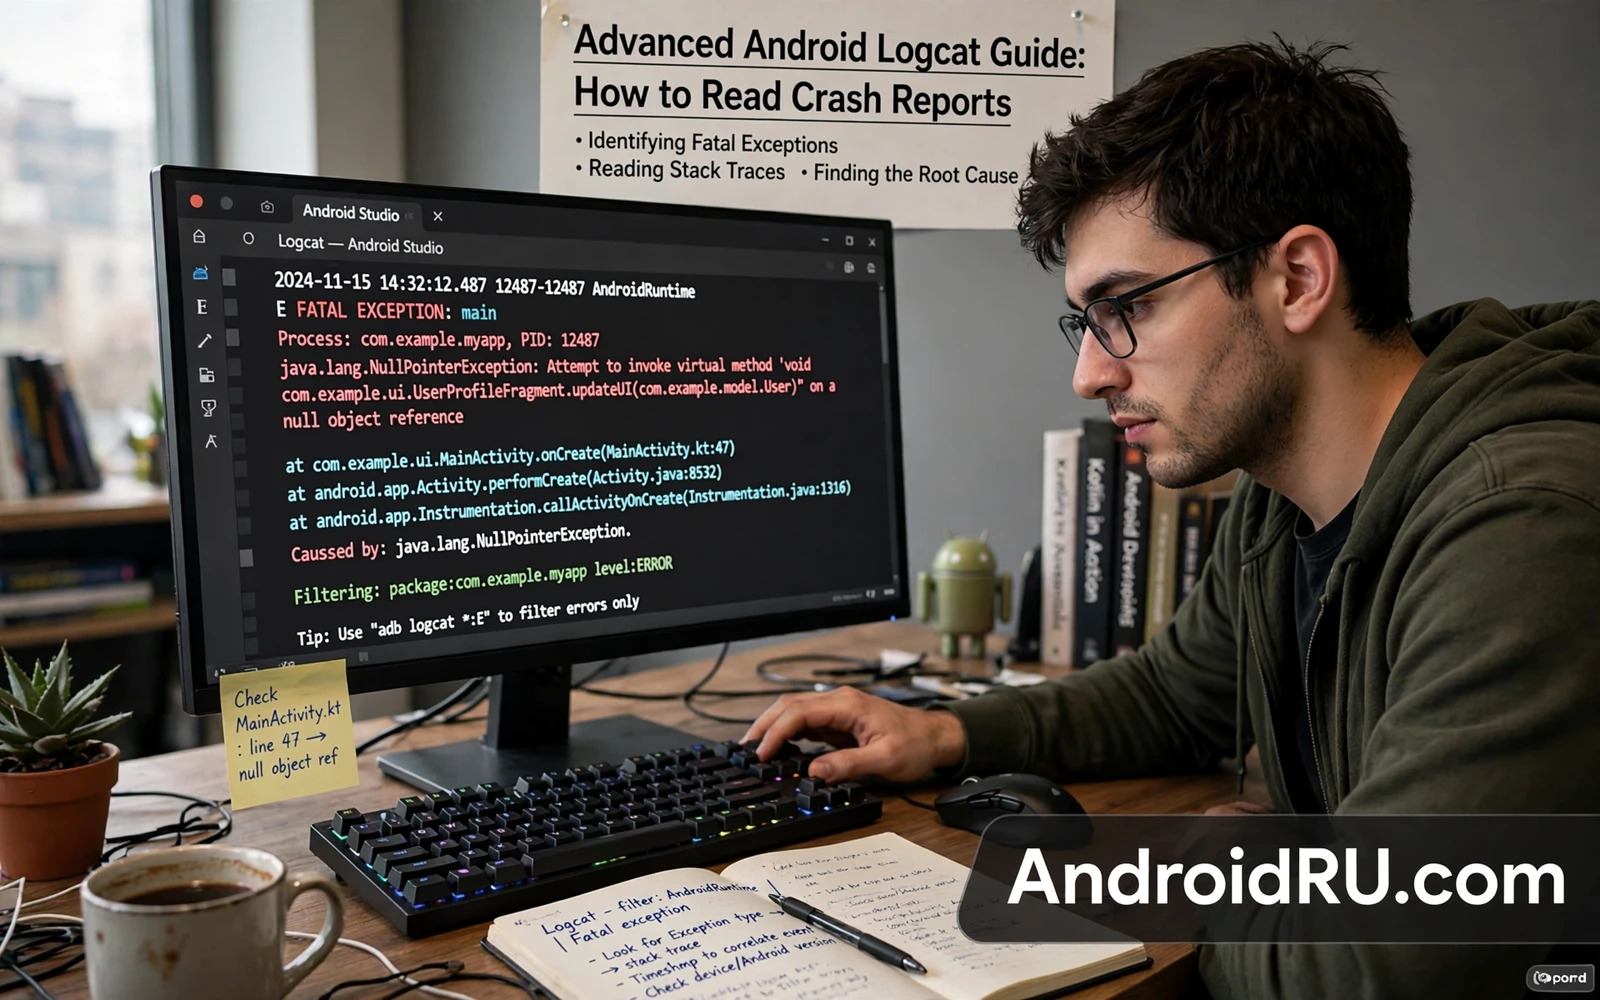
Advanced Android Logcat Guide: How to Read Crash Reports
A phone app closes the second you tap it, or it freezes on a black screen, or it restarts your whole session without a word. The screen tells you nothing useful. Logcat tells you almost everything. I learned this the hard way while chasing a crash that only happened on one phone model, only on mobile data, and only after the app had been open for ten minutes. The fix took four minutes once I read the log properly. Finding the right lines took two evenings because I kept staring at the wrong part of the output.
This guide shows you how to capture a clean log, how to read a stack trace line by line, and how to match common crash patterns to real causes. You will use real ADB commands, real log levels, real buffers, and real exception examples. No guesswork, no vague advice about restarting the phone. By the end you should be able to open a crash report, find the line that matters, and say what broke and why.
Who this is for: Android users who sideload or test apps, modders who flash modules, developers who debug on a real device, and anyone who has ever sent a bug report that said only “it crashes”. If you can plug a phone into a computer and type a command, you can do this.
What Android Logcat Actually Records and Where Crash Reports Live
Logcat is the logging system built into Android. Apps, system services, and the kernel all write short text lines into shared memory buffers. Each line carries a timestamp, a process ID, a thread ID, a log level, a tag, and a message. When an app crashes, the Android runtime writes a block that starts with FATAL EXCEPTION, names the exception, prints the message, and then lists the stack trace: the chain of method calls that led to the failure, top first.
That block is the crash report most people mean when they say “logcat”. It lives in the main buffer, alongside thousands of routine lines from other apps and services. The trick is not finding logs. The trick is cutting away the noise so the crash block stands out. A crash report is a stream, not a file on your home screen, and it scrolls past fast on a busy phone. Capture it to a file the moment it happens, or it will be pushed out of the ring buffer by newer lines.
Crash reports also appear in other places. Android keeps a dropbox of recent crashes that bug report tools can read. Developers see crash clusters in the Play Console when users opt in. A bug report taken from Developer options (adb bugreport) bundles logcat with dumpsys output, battery stats, and service states. For most hands-on diagnosis, though, a direct logcat capture around the moment of the crash gives you the fastest answer with the least clutter.
How a crash report is structured from first line to last
Read a crash block from the top. The first line tells you the process and the thread: FATAL EXCEPTION: main means the crash happened on the main thread, the thread that draws the screen and handles taps. A crash on a background thread names that thread instead, such as OkHttp Dispatcher or a worker thread from a library. Next comes the exception type and its message, for example java.lang.NullPointerException: Attempt to invoke virtual method on a null object reference. After that comes the stack trace, a list of at com.example.app.MainActivity.onCreate(MainActivity.java:42) lines. The first at line is where the exception was thrown. The lines below it show who called that method, and who called the caller, all the way back to the Android framework.
Below the stack trace you often find lines that name the cause. Caused by: points at the deeper exception when one exception wraps another. A crash that starts as a RuntimeException may hide an IllegalStateException or a SecurityException underneath, and the Caused by line is the real story. Read the whole block before you act. I once fixed the wrong method because I stopped at the first at line and missed a Caused by three lines down that named a missing permission.
The difference between a crash, an ANR, and a silent kill
Not every app death is a crash. An ANR, Application Not Responding, happens when the main thread blocks for about five seconds while handling input, or about ten seconds while handling a broadcast. Logcat shows Input dispatching timed out and the system writes a traces file. The fix is usually moving slow work off the main thread. A silent kill is different again: the system low-memory killer removes a background app to free RAM, and logcat shows lines from ActivityManager about killing a process for memory reasons, with no FATAL EXCEPTION at all. A third case is a native crash in C or C++ code, which prints a tombstone with signal 11 (SIGSEGV) and register dumps instead of a Java stack trace. Each type needs a different fix, so naming the type first saves you from chasing a Java bug when the real problem is memory pressure.
What to note before you reproduce a crash
Write down four facts before you start: the app version, the Android version, the exact taps that trigger the crash, and whether it happens every time or only sometimes. A crash that happens every time on the same screen is far easier to fix than one that happens once a week. Note the time on the phone clock too, so you can search the log by timestamp later.
Setting Up ADB Logcat Capture the Right Way
ADB, the Android Debug Bridge, is the reliable way to capture logs. It runs on your computer, talks to the phone over USB or Wi-Fi, and keeps recording even when the app under test dies. On-device log reader apps can work, but Android restricts them on newer versions, and a reader running inside the same phone can itself be killed or paused. A computer capture survives the crash, which is exactly when you need it most.
Set it up once and the routine becomes second nature. On the phone, open Settings, go to About phone, and tap Build number seven times until Developer options appears. Open Developer options and turn on USB debugging. Plug the phone into the computer, accept the RSA fingerprint prompt on the phone, and check the connection with adb devices. You should see your phone listed as device, not unauthorized and not offline. If it says unauthorized, unplug, revoke USB debugging authorizations in Developer options, and plug in again.
Your first clean capture in four commands
Start with a clear buffer so old lines do not confuse you. Then start the capture, reproduce the crash, and stop the capture. The commands below are the core routine I use for almost every crash I investigate.
adb devices
adb logcat -c
adb logcat -v threadtime > crash.log
adb logcat -d > crash.log
The first command confirms the connection. The second, adb logcat -c, clears all buffers, so the log starts clean. The third starts a live capture with threadtime format and writes it to crash.log; press Ctrl+C to stop it after you reproduce the crash. The fourth, adb logcat -d, dumps the current buffer once and exits, which is handy when the crash already happened and you want a quick snapshot without a live session. Use -d when you need a fast copy, and use the live form when you want to watch lines appear while you tap through the app.
Reading a log line: timestamp, PID, TID, level, tag, message
The -v threadtime format prints lines like this: 11-07 14:32:10.512 12345 12346 E MyApp: Something failed. The date and time come first, then the process ID (12345), then the thread ID (12346), then the level letter (E for error), then the tag (MyApp), then the message. PID lets you follow one app across thousands of lines. TID tells you whether the work ran on the main thread or a background thread. The tag tells you which component wrote the line. Learn to read these five fields at a glance and the log stops looking like noise.
Other formats exist. The brief format drops the timestamp, which makes it harder to match a crash to the moment you tapped. The long format spreads each line over several lines, which is readable but bulky. The color format adds colour to levels in a terminal. Threadtime is the best default for crash work because it keeps PID, TID, and time on every line without wasting space.
USB debugging over Wi-Fi when a cable is not handy
On Android 11 and later you can pair over Wi-Fi from Developer options, under Wireless debugging. Tap Pair device with pairing code, then run adb pair on the computer with the address and code shown. After pairing, connect with adb connect. Wi-Fi capture works well for crashes that involve unplugging the phone or testing motion, but a cable is steadier for long captures, and some phones drop the Wi-Fi ADB session when the screen sleeps.
Android Logcat Levels and Buffers Explained
Every log line has a level, and every level has a job. Filtering by level is the fastest way to shrink a log from fifty thousand lines to a few hundred. The catch is that filtering too hard hides the warning that came before the error. Start broad, find the crash, then read backwards through the warnings that led up to it.
| Level | Letter | What it means | When to use it |
|---|---|---|---|
| Verbose | V | Fine-grained detail, often inside loops | Deep debugging of one feature |
| Debug | D | Development information and state changes | Tracing a flow through code |
| Info | I | Normal operation, lifecycle events | Confirming a screen or service started |
| Warning | W | Something odd, but the app keeps running | Reading the minutes before a crash |
| Error | E | A failure in one operation | Finding what broke first |
| Fatal | F | A crash, usually with FATAL EXCEPTION | Locating the crash block itself |
| Silent | S | Nothing is printed for this tag | Muting a chatty tag |
Use adb logcat *:W to show warnings and above, or adb logcat *:E to show errors and above. A common working pattern is to capture everything with *:V into a file, then filter the file afterwards, so you never lose a warning you later realise you needed. Disk space is cheap. A lost warning is not.
The five log buffers and which one holds your crash
Android keeps several ring buffers, each with its own purpose and its own size limit. The main buffer holds most app and framework logs, including crash reports. The system buffer holds system service logs. The radio buffer holds telephony and mobile data logs. The events buffer holds binary system events such as boot and battery changes. The crash buffer holds crash-related records on some devices. When you run plain adb logcat you read the main, system, and crash buffers together. Asking for a specific buffer narrows the view when you know where the problem lives.
| Buffer | Flag | What lives there | Typical use |
|---|---|---|---|
| main | -b main | App logs and Java crash reports | Almost every app crash |
| system | -b system | System services, ActivityManager | App kills, service restarts |
| radio | -b radio | Telephony, mobile data, SIM | Signal and call failures |
| events | -b events | System events, boot, battery | Boot and power problems |
| crash | -b crash | Crash records on some builds | Quick crash-only scan |
| all | -b all | Every buffer together | Full context for a hard bug |
Try adb logcat -b main -b system -b crash when an app crash also involves a service restart, and add -b radio when the crash follows a loss of signal. A boot problem belongs in the events buffer, and that is where a phone stuck in a loop leaves its earliest clues. If your phone keeps restarting after a module or ROM change, read how to fix bootloop issues after installing modules or ROMs alongside the events buffer, because the log and the fix belong together.
How big is a buffer and why old lines vanish
Each buffer is a ring: when it fills, the oldest lines are overwritten. Default sizes are often 256 KB per buffer on older phones and larger on newer ones, and you can raise them in Developer options under Logger buffer sizes. A busy phone can fill a small buffer in a minute or two. That is why you clear the buffer, reproduce fast, and save to a file. If the crash happened an hour ago and you only open logcat now, the crash block may already be gone. Check the buffer size first on a phone that logs heavily, and raise it to 4 MB or 16 MB before a long test session.
How to Read a Crash Stack Trace Step by Step
Here is the skill this whole guide builds toward. Take a real stack trace, read it top to bottom, and pull out four answers: what exception, where it was thrown, what the app was doing, and what caused it. Work through the example below slowly. It is a NullPointerException, the most common crash in Android apps, and the reading method works for every other exception too.
11-07 14:32:10.512 12345 12345 E AndroidRuntime: FATAL EXCEPTION: main
11-07 14:32:10.512 12345 12345 E AndroidRuntime: Process: com.example.shop, PID: 12345
11-07 14:32:10.512 12345 12345 E AndroidRuntime: java.lang.NullPointerException: Attempt to invoke virtual method 'java.lang.String com.example.shop.User.getName()' on a null object reference
11-07 14:32:10.512 12345 12345 E AndroidRuntime:   at com.example.shop.ProfileActivity.onCreate(ProfileActivity.java:42)
11-07 14:32:10.512 12345 12345 E AndroidRuntime:   at android.app.Activity.performCreate(Activity.java:8000)
11-07 14:32:10.512 12345 12345 E AndroidRuntime:   at android.app.ActivityThread.performLaunchActivity(ActivityThread.java:3400)
Line one names the thread: main. Line two names the process and PID, which confirms which app crashed. Line three is the exception and its message: a NullPointerException because the code called getName() on a User object that was null. Line four is the gold: ProfileActivity.onCreate, file ProfileActivity.java, line 42. That is where the null object was used. The lines below it are framework code that launched the activity; they tell you the crash happened while the screen was opening, not while a button was pressed. The fix, in plain terms, is to check whether the User object exists before calling getName(), or to load it before the screen opens.
Step one: find FATAL EXCEPTION and read the exception line
Search the file for FATAL EXCEPTION. There may be more than one if the app crashed twice, so check the timestamp of each and pick the one that matches the moment you reproduced the bug. Read the exception type and message as a sentence. NullPointerException means something was null. IllegalArgumentException means a bad value was passed. IndexOutOfBoundsException means code asked for item 5 in a list of 3. SecurityException means a permission was missing. OutOfMemoryError means the app ran out of heap. Each type points at a different family of fixes, and naming it first stops you from guessing.
Step two: read the first app frame, not the first framework frame
The first app frame in the stack trace is usually your answer, but only if it names your app package. Lines that start with android.app, android.os, java.lang, or androidx are framework code. Skip past them to the first line that names the app package, such as com.example.shop. That frame is the method in the app that was running when the exception was thrown. Note the file name and line number. If the app is obfuscated with R8 or ProGuard, the names will look like a.b.c, and you need the mapping file to translate them back. That is a build detail, not a logcat problem, and the developer who built the app holds the mapping.
Step three: follow the Caused by chain to the root
Some traces end with Caused by: and a second exception. Always read the last Caused by in the chain, because it is the deepest cause. A typical chain reads RuntimeException caused by IllegalStateException caused by SecurityException, and the SecurityException at the bottom is the one to fix. If you stop at the top, you fix a symptom. If you read to the bottom, you fix the cause. The chain also tells you which library wrapped the error, which matters when the bug sits in a third-party SDK rather than in the app itself.
Step four: read backwards for the warning that predicted the crash
Scroll up from the FATAL EXCEPTION line and read the previous thirty to sixty seconds of warnings and errors from the same PID. Look for failed network calls, permission denials, database errors, or out-of-memory warnings. reading backwards from the crash is where most diagnoses are won. A crash that looks random often has a clear warning trail: a network timeout at 14:31, a retry that returned null at 14:32, and a NullPointerException at 14:32:10 when the code used that null result. The crash line tells you where the app died. The lines before it tell you why it was already in trouble.
A worked example: SecurityException from a missing permission
A SecurityException with the message “Neither user 10234 nor current process has android.permission.ACCESS_FINE_LOCATION” means the app tried to read fine location without holding the permission. The stack trace shows the location call, the Caused by line names the permission, and the lines above the crash often show a permission request that the user denied, or a check that was skipped. The fix is to request the permission at runtime and to handle a denial gracefully instead of calling the location API anyway. On Android 12 and later, approximate location adds another wrinkle: an app granted only approximate location that asks for fine location will hit the same exception.
A worked example: OutOfMemoryError from a large image
An OutOfMemoryError with “Failed to allocate a 268435468 byte allocation” almost always means a bitmap was loaded at full size. A photo from a modern camera can be 12 megapixels or more, and loading it without sampling needs hundreds of megabytes. The stack trace usually names BitmapFactory.decodeStream or a Glide or Coil call. The lines above it often show several large allocations in a row, or a list that keeps images in memory. The fix is to load a sampled-down version sized to the screen, to cache on disk instead of in memory, and to release bitmaps when a screen closes. If the same app crashes while scrolling a gallery, that pattern confirms the diagnosis.
Common Android Crash Patterns and What Each One Means
After you have read a dozen crash reports, patterns start to repeat. The same exception types show up with the same messages and the same fixes. The table below covers the patterns I see most often, with the usual cause and the first thing to check. Keep it open next to your log file while you work through a new crash.
| Exception | Typical message | Usual cause | First check |
|---|---|---|---|
| NullPointerException | Attempt to invoke method on a null object reference | Object not loaded or returned null | First app frame, null check |
| SecurityException | Neither user nor process has permission | Missing runtime permission | Manifest and runtime request |
| OutOfMemoryError | Failed to allocate a large byte allocation | Full-size bitmap or memory leak | Image loading and caches |
| IllegalStateException | Can not perform this action after onSaveInstanceState | Fragment action after state saved | Commit timing, commitAllowingStateLoss |
| IndexOutOfBoundsException | Index 5 out of bounds for length 3 | List changed while reading it | Adapter data and notify calls |
| ClassNotFoundException | Didn’t find class on path DexPathList | Missing class after shrinking | R8 rules and multidex setup |
| NetworkOnMainThreadException | Network operation on main thread | Network call on the UI thread | Move call to a background thread |
| ActivityNotFoundException | No Activity found to handle Intent | Intent with no matching app | Resolve the intent before starting it |
| SQLiteException | No such table or database is locked | Bad migration or concurrent write | Database version and transactions |
| BadTokenException | Unable to add window, token is not valid | Dialog shown after activity finished | Activity state before showing dialog |
Two of these deserve extra attention because they confuse beginners. IllegalStateException after onSaveInstanceState happens when code tries to commit a fragment transaction after Android has saved the screen state, often from a slow network callback that arrives after the user left the screen. The fix is to check the lifecycle state before committing, or to post the work to the next resume. NetworkOnMainThreadException is Android telling you plainly that a network call ran on the main thread; the fix is to move it to a background thread with a coroutine, a worker, or an async call, and it is one of the few crashes where the exception name is the whole diagnosis.
Native crashes and tombstones: when there is no Java trace
A native crash prints a different shape: a line with Fatal signal 11 (SIGSEGV), a fault address, and a backtrace of memory addresses and library names such as libexample.so. These crashes come from C or C++ code, often in a game engine, a media codec, or a native library. Read the backtrace for the first library that belongs to the app rather than to the system, and note the signal: SIGSEGV means a bad memory access, SIGABRT means an abort call, SIGBUS means a bad alignment or mapping. Native crashes are harder to fix from logcat alone, but the library name and the signal narrow the search to one component, and that is usually enough to file a useful bug report or to test an older version of that library.
ANR traces: reading traces.txt when the app freezes
When an app freezes, pull the ANR trace with adb pull /data/anr/traces.txt and search for the main thread section. The trace shows what the main thread was doing when the system declared it unresponsive: waiting on a lock, reading from disk, or stuck in a network call. Look for the word BLOCKED or for a thread holding a lock that the main thread wants. A deadlock shows two threads waiting on each other. The fix is the same family as the crash fix: move the slow work off the main thread and shorten the critical section that holds the lock.
Filtering Logcat Like a Pro: Tags, PIDs, Grep, and Time Ranges
A raw capture from a busy phone can pass 100,000 lines in a few minutes. Filtering is not optional. The good news is that a handful of filters covers almost every investigation, and you can combine them. Capture everything to a file first, then filter copies of the file, so you can try a filter, discard it, and try another without losing the original capture.
Filter by tag when you know which component wrote the lines you want. Filter by PID when you know which app crashed. Filter by level when you want errors only. Use grep when you want one word, such as FATAL or a package name, across the whole file. Combine them when one filter alone still leaves too much noise. The commands below are the ones I reach for most, in the order I usually try them.
adb logcat -s MyAppTag
adb logcat --pid=12345
adb logcat *:E
adb logcat -v threadtime | grep -i "fatal|exception"
adb logcat -d -t "11-07 14:30:00.000"
adb logcat -v threadtime -b main -b system
tag and PID filtering turns a flood of lines into one app story. The -s flag sets a tag filter and silences the rest, so adb logcat -s MyAppTag shows only lines tagged MyAppTag. The –pid flag limits output to one process, which is ideal once you know the PID from the crash line. The *:E form shows errors and above from every tag. Piping through grep -i finds fatal and exception lines regardless of level, which catches crash blocks that were logged at an odd level. The -t flag with a timestamp prints logs since that time, so you can pull only the minute around the crash. The last command reads the main and system buffers together with threadtime format, which is my default for a full investigation.
Finding the PID of a crashing app fast
Run adb shell pidof com.example.shop to get the PID of a running app by package name, or adb shell ps -A | grep com.example.shop when pidof is not available. The PID changes every time the app restarts, so fetch it fresh for each capture. A handy shortcut is to capture with the package name in grep: adb logcat -v threadtime | grep com.example.shop, though that misses system lines from ActivityManager that mention the package in a different form. For a crash report, filter by PID after you know it, and keep a second capture by package name for the surrounding context.
Grep patterns that find crashes in a huge file
Open the saved file and search for these strings in order: FATAL EXCEPTION, AndroidRuntime, Caused by, and the app package name. Then search for the exception types you expect: NullPointerException, SecurityException, OutOfMemoryError, IllegalStateException. A single grep -n “FATAL EXCEPTION” crash.log gives you the line numbers of every crash in the file, and grep -n -A 30 “FATAL EXCEPTION” crash.log prints each crash block with thirty lines of context. Save those patterns in a note. They turn a 100,000-line file into a ten-line answer.
Filtering by time when you know the crash minute
When you noted the clock time before reproducing the crash, use adb logcat -d -t with that timestamp to dump only the lines since then. The -T flag does the same for a live session. Time filtering is the cleanest way to cut a long capture down to the minute that matters, and it avoids the risk of a grep pattern missing a crash that was logged with an unusual tag. Combine a time filter with a PID filter for the tightest useful view: the right app, in the right minute, and nothing else.
Capturing Logs Without a Computer and Sharing Them Safely
Sometimes the crash happens away from your desk, on a bus or in a shop, and there is no computer nearby. Android still gives you options. The built-in bug report is the strongest: hold the power button, or go to Developer options and tap Take bug report, then choose Interactive report. Android gathers logcat, dumpsys, and system state into a ZIP file you can share later. It takes a minute or two to build, and it is large, but it is the most complete record you can get without ADB.
On-device log reader apps are the second option. On Android 11 and later they need special permission granted through ADB, with a command like adb shell pm grant, and their access is limited compared with a computer capture. They are useful for a quick look, but they are not a replacement for ADB when the crash is hard to reproduce. If you use one, export the log to a file at once and move it to your computer before the buffer rolls over.
A third option is the app’s own feedback path. Many apps include a “send feedback” or “report a bug” screen that attaches a recent log excerpt automatically. That excerpt is often short and filtered, but it is better than a report that says only “it crashes”. If you are reporting a crash to a developer, attach the full file when you can. A developer who gets the whole stack trace can fix the bug in one pass. A developer who gets only a screenshot of the error dialog has to guess.
Redacting private data before you share a log
Logs can contain tokens, email addresses, phone numbers, location coordinates, and message text. Before you post a log in a public forum or send it to a stranger, search it for your email address, your phone number, and any string that looks like a token or a key, such as a long run of letters and digits after Authorization or token=. Replace those values with [REDACTED] and keep the stack trace and the error lines intact. Keep a private copy of the original, because a redacted log can hide the very value that caused the bug, and you may need the original if the developer asks for the unredacted line.
That said, do not over-redact. Removing the package name, the PID, or the timestamps makes the log much harder to read. Redact secrets and personal data, keep the technical lines, and say in your report what you removed. A clear note about redaction builds trust with the developer and avoids a round of questions about missing lines.
What a good bug report looks like after you read the log
A good bug report has five parts: the app version and Android version, the exact steps to reproduce, the expected result, the actual result, and the crash block from logcat. Paste the FATAL EXCEPTION block in a code block, add the ten lines above it for context, and name the exception in the report title. “NullPointerException in ProfileActivity.onCreate on version 2.4.1” gets fixed faster than “app crashes”. Attach the full log file when the forum or tracker allows it. That report is the difference between a bug that sits untouched for months and one that is fixed in the next release.
Fixing the Crash After You Read the Report
Reading the report is half the job. The other half is deciding what to do with it. If you are the developer, the stack trace points at the file and line to change, and the fix usually falls into one of a few families: add a null check, request a permission before using it, load a smaller image, move work off the main thread, or handle a denied result instead of assuming success. Make the smallest change that fixes the cause, test the exact reproduction steps, and check that the crash is gone in a fresh log.
If you are a user rather than a developer, the log still gives you leverage. Clear the app cache and data only after you have saved the log, because clearing data can erase the state that caused the crash. Check for an app update, because the crash may already be fixed in a newer version. If the crash follows a system update or a module install, the log may point at a module rather than at the app, and that changes the fix entirely. When a crash appears right after you change screen density or resolution, read how to change device screen resolution and DPI via ADB to check whether the new density pushed a layout or a resource lookup into a bad state, and revert the change to test.
When a crash resists every simple fix, widen the search. Try the app on a different Android version, or with a different account, or on Wi-Fi instead of mobile data. Each test rules out one variable. Keep notes on what you tried and what changed, because a crash that moves when you change one variable is telling you where the fault lives. The log is the map. The tests are the walk.
When the crash points at a module, a ROM, or a tool
Some crashes are not the app’s fault. A module that hooks into the app can change its behaviour, a custom ROM can change a system API, and a tweaking tool can change a setting the app depends on. The stack trace often names the hooking library or shows a framework method behaving in an unexpected way. Disable modules one at a time and retest, starting with the most recently installed. For a broader view of the tools involved, read top Android modding utilities every tweaker needs and compare the tools you have installed against the ones the crash implicates. A clean test with all modules disabled tells you whether the app itself is at fault or whether the environment around it is.
Verifying the fix with a second capture
After a fix, repeat the exact reproduction steps with a fresh capture: adb logcat -c, then adb logcat -v threadtime, then the same taps, then search the new file for FATAL EXCEPTION. No match means the crash is gone for that path. Also check that the warnings you saw before the crash are gone or reduced. A fix that removes the crash but leaves the same warning trail may have hidden the symptom rather than fixing the cause. Run the app for a few minutes longer than the original crash took to appear, because a fix that only delays the crash is not a fix.
Frequently Asked Questions About Android Logcat and Crash Reports
Can I read logcat without root and without a computer?
Yes, for your own app crashes you can use the bug report tool in Developer options without root, and it needs no computer at the moment of capture. You still need a computer or a file manager to read the resulting ZIP comfortably, and on-device reader apps have limits on newer Android versions. ADB from a computer remains the most complete method, but a bug report is a strong fallback when you are away from your desk.
Why does adb logcat show nothing for my app?
Four causes cover most cases. The phone may not be authorised for USB debugging, so run adb devices and check for unauthorized. The buffer may have been cleared after the crash, so reproduce again with a live capture running. The filter may be too strict, so try adb logcat -v threadtime with no filter first. Or the app may write its logs at a level you filtered out, so start with *:V and narrow down afterwards instead of starting narrow.
How long do logcat lines stay in the buffer?
It depends on buffer size and how chatty the phone is. With the default size on a busy phone, lines can roll over in a minute or two. With a 16 MB buffer set in Developer options, the same phone may keep tens of minutes of logs. The safe habit is to capture to a file continuously during a test, rather than relying on the buffer to hold the crash until you get around to reading it.
Is it safe to share a full logcat file in public?
Not without checking it first. Logs can include tokens, account identifiers, location data, and message text. Search for your email, phone number, and any token-like strings, redact them, and keep the stack trace intact. Share the full file privately with the developer when possible, and share a redacted excerpt in a public forum. A log that leaks a token can be worse than the crash it documents.
What is the difference between logcat -d and a live logcat session?
The -d flag dumps the current buffer once and exits, which is ideal for a quick snapshot of a crash that already happened. A live session with no -d keeps printing new lines until you stop it with Ctrl+C, which is ideal when you want to watch the log while you reproduce the crash. Use -d for a fast check, use a live session for a reproduction, and save both to a file so you can search them later.
Reading crash reports is a skill that pays off every time an app misbehaves. Start with a clean buffer, capture the crash, find FATAL EXCEPTION, read the first app frame, follow the Caused by chain, and read the warnings that came before. Those five moves solve most crashes, and the rest is practice. The next time an app closes without explanation, open a terminal, run the capture, and let the log tell you what the screen would not.

