

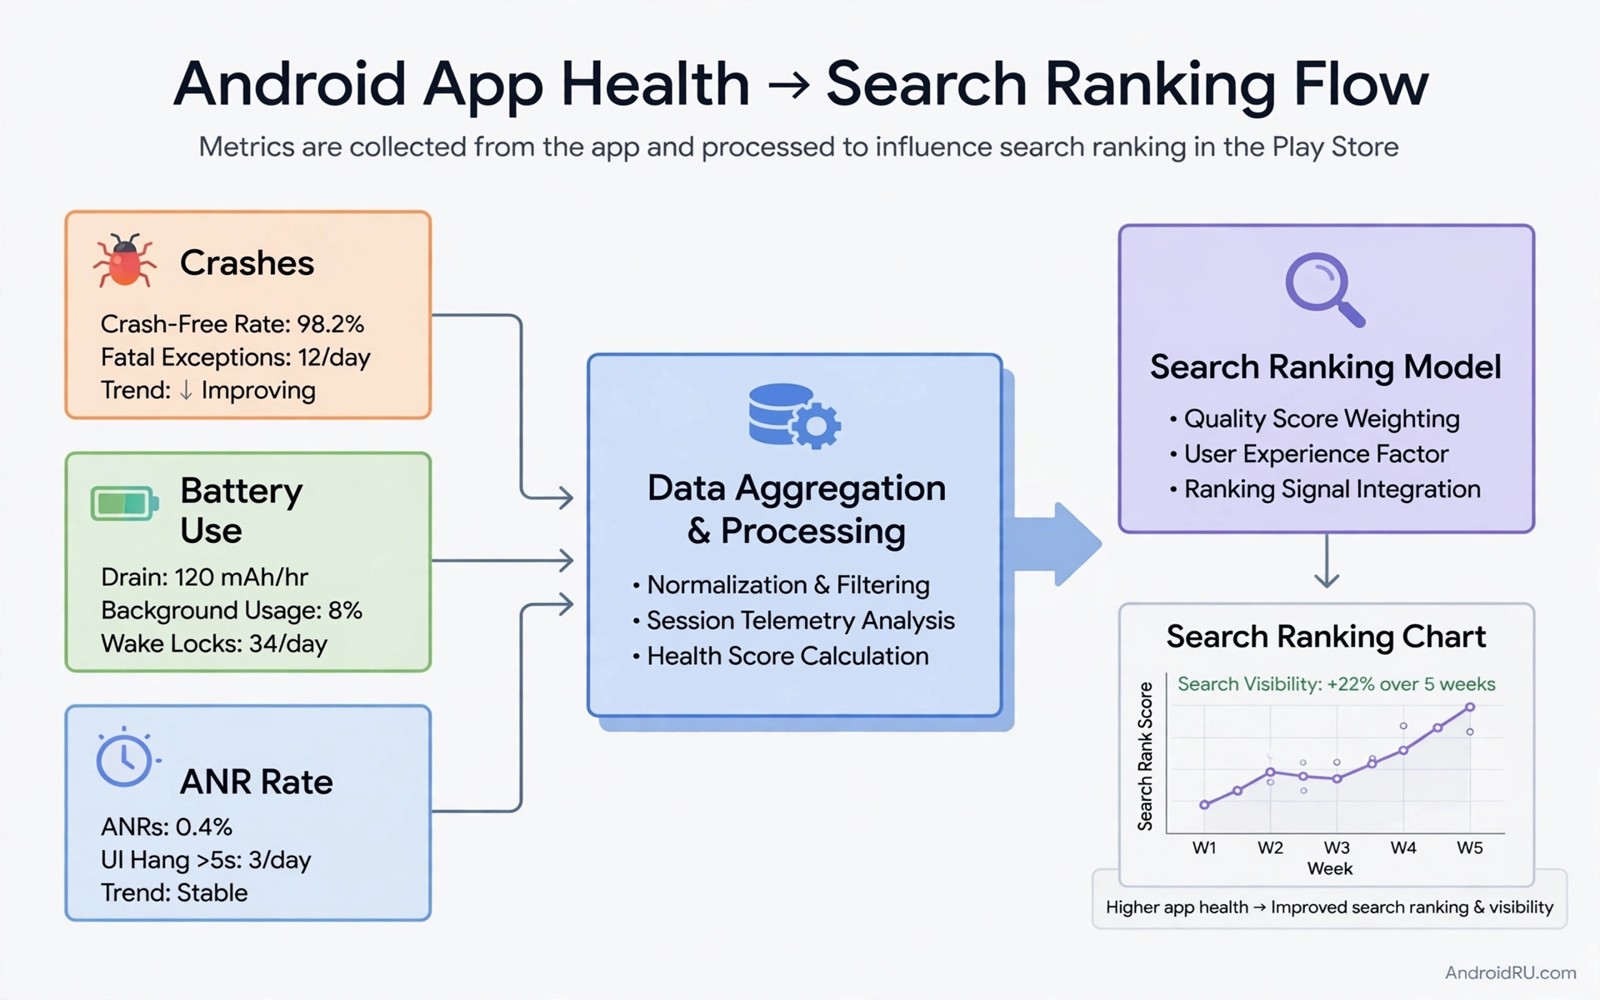
Android Vitals is a set of quality metrics that Google Play reports for an app. It includes crash rates and app not responding rates and slow startup times and excessive wakeups. Those metrics describe how an app behaves on real user devices. They matter because poor quality hurts users and it can also hurt how an app appears in the store.
A crash rate tells you how often an app stops unexpectedly for users. An ANR rate tells you how often the app freezes for too long. A slow startup metric tells you how long users wait before they can use the app. Each metric has a threshold that marks poor behaviour. Crossing a threshold can reduce visibility and it can trigger a warning for users.
This guide explains how Vitals metrics work and how to improve them for your own apps. It focuses on measurement and on fixes that help real users. It does not promise a ranking trick. Quality improvements that help users are the only sustainable way to improve Vitals and store performance together.
The core Vitals metrics in plain terms
Crash rate measures the share of daily sessions that end in a crash. A crash may come from a null value or a bad state or a native error. A single crash type that affects many users can raise the rate fast. A crash that affects only a few users on an old device may still matter if it points to a real bug in a shared code path.
ANR rate measures the share of sessions where the app stops responding for too long. An ANR often comes from heavy work on the main thread. Network calls and database queries and image processing on the main thread are common causes. Moving that work to a background thread usually fixes the ANR and it improves responsiveness for all users.
Startup time and wakeup metrics complete the core set. Slow startup frustrates users before they even reach a feature. Excessive wakeups drain battery by waking the device too often. Both metrics reflect design choices such as lazy loading and efficient background work. Small design changes can improve both metrics noticeably.
How Vitals relates to store visibility
Play Store ranking uses many signals and quality is one of them. An app with high crash rates may rank lower for similar searches than a stable app with similar features. That effect is not a punishment for its own sake. It reflects the idea that users prefer apps that work reliably. A stable app gives users a better experience and the store reflects that preference.
Vitals thresholds also affect badging and warnings. An app that crosses a poor behaviour threshold may show a warning to users before they install it. That warning reduces installs even when the app has strong features. Fixing the metric removes the warning and restores a normal install flow. The fix helps users first and visibility second.
Do not chase a single metric in isolation. A fix that reduces crashes but causes ANRs has not improved overall quality. Review all core metrics together after each release. A balanced improvement across crashes and ANRs and startup time gives a stronger result than a dramatic improvement in one metric alone.
Finding the real cause of a bad metric
Start with the Vitals dashboard for your app and sort issues by impact. Look for the crash type with the most affected users and the ANR type with the longest main thread block. Those top issues give the largest improvement per fix. A long list of tiny issues can wait while a top issue affects thousands of users.
Use stack traces and device data to understand each top issue. A crash on one Android version may point to a behaviour change in that version. A crash on one device family may point to a hardware specific path. Group issues by version and device and app version before you guess a cause. Grouping reveals patterns that a single report hides.
Reproduce the top issue on a test device when possible. A reproduction gives you a concrete test for the fix. A fix without a reproduction may look correct but fail in real use. Record the reproduction steps in the issue note so another developer can verify the fix later without rediscovering the steps.
Fixing crashes ANRs and slow startup
Fix crashes by handling null values and invalid states explicitly. Add guards for data that comes from a server or from user input. Test edge cases such as empty lists and missing fields. A guard that looks boring in code review often prevents the most common crash type in production.
Fix ANRs by moving heavy work off the main thread. Use background workers for network and database and image tasks. Show a loading indicator while background work runs. A responsive interface with a clear loading state feels better than a frozen interface even when total time is similar.
Fix slow startup by deferring work that is not needed for the first screen. Load the first screen fast and load other features after the user can interact. Remove heavy initialisation from the startup path. Measure startup time before and after each change with a real device and a cold start.
- Handle null values and invalid states explicitly.
- Move heavy work off the main thread.
- Defer non essential work from the startup path.
- Measure each fix on a real device with a cold start.
Code you can adapt
// Move database work off the main thread with a coroutine
// This pattern avoids ANRs from slow queries on the main thread
lifecycleScope.launch {
    val items = withContext(Dispatchers.IO) {
        database.noteDao().allNotes()
    }
    // Update the interface on the main thread after loading.
    adapter.submitList(items)
}
The snippet above is an original example written for this guide. It shows a background thread pattern that prevents a slow database query from blocking the main thread.
The pattern separates loading from display. Loading runs on a background thread where a slow query cannot freeze the interface. Display runs on the main thread after loading finishes. That separation is a core habit for responsive Android apps and it fixes many ANR reports at once.
Test the pattern with a large data set on a slow device. A fast device can hide a main thread problem that a slow device reveals. A slow device test gives a realistic ANR check. Use the slowest device in your supported range for ANR testing when possible.
How this topic connects to nearby work
Heat related slowdowns feed the same quality metrics and the thermal side is covered by Android thermal management tables.
Slow queries can raise the same user frustration signals as the database problem in the guide to Room database indexing optimization.
Architecture choices affect startup and responsiveness in the ways compared in the guide to MVVM vs MVI architecture patterns.
Putting it into practice
Staged rollout monitoring turns Vitals into an early warning system. Release a new version to a small share of users first and watch crash and ANR rates for that version. A sharp rise in a metric for the new version points to a regression that the staged rollout can contain. Pause the rollout when a metric crosses a threshold and investigate before expanding to all users. That discipline prevents a bad release from reaching everyone.
Metric segmentation by device and country reveals patterns that a global average hides. A crash that affects only one device family will look small in a global rate. Segmenting by device shows the true impact for users of that family. Segmenting by country can reveal a network or locale related cause. Use segmentation before deciding that a metric change is unimportant.
A final Vitals check should compare metrics before and after a fix for the same app version cohort. Users on an old version will keep generating old metrics until they update. A comparison that mixes old and new versions will understate the improvement from a fix. Filter the dashboard to the fixed version only when judging a fix. That filtered view shows the true effect of the change. Record the version filter with the result so the comparison can be reproduced.
Common mistakes
A common mistake is to fix only the crash that you saw on your own phone. Production crashes often affect device models and versions that you do not own. Use the Vitals dashboard to find the top crash by affected users. Fix that crash first even if you cannot reproduce it on your own phone.
Another mistake is to add a catch all handler that hides crashes without fixing them. A hidden crash may stop showing in metrics while the user experience stays broken. Fix the root cause rather than hiding the symptom. A visible crash with a clear stack trace is easier to fix than a silent failure.
A third mistake is to optimise startup by removing features that users need. A fast startup that shows an empty screen is not a good experience. Load the first screen fast and load other features in the background. Balance speed with usefulness for the first user interaction.
Frequently asked questions
What crash rate counts as poor behaviour in Vitals?
Thresholds change over time and they vary by metric. Check the current Vitals dashboard for your app because it shows the threshold beside your rate. Focus on reducing your rate toward the best performing apps in your category rather than chasing a single fixed number.
Can a single bad release hurt Vitals for a long time?
A bad release can raise metrics for the period when users run that version. A fixed release and a rollout to users will improve metrics as users update. Monitor the dashboard after a fix and confirm that the rate falls as adoption of the fixed version grows.
Do Vitals metrics affect existing users or only new installs?
Vitals reflect real user experience for existing users directly. Store visibility effects mainly affect discovery by new users. Both effects matter. Existing users suffer poor quality directly while new users may see warnings or lower ranking.
Conclusion
Android Vitals turns real user experience into measurable quality signals. Crashes and ANRs and startup time and wakeups each point to a different kind of problem. Fixing the top issue by affected users gives the largest improvement. Balanced fixes across all core metrics improve both user experience and store visibility in a sustainable way.
Your concrete next step is to open the Vitals dashboard for your own app today and note the top crash and the top ANR by affected users. Write a reproduction plan for each one before your next release. That plan turns a metric into a fixable engineering task.

