

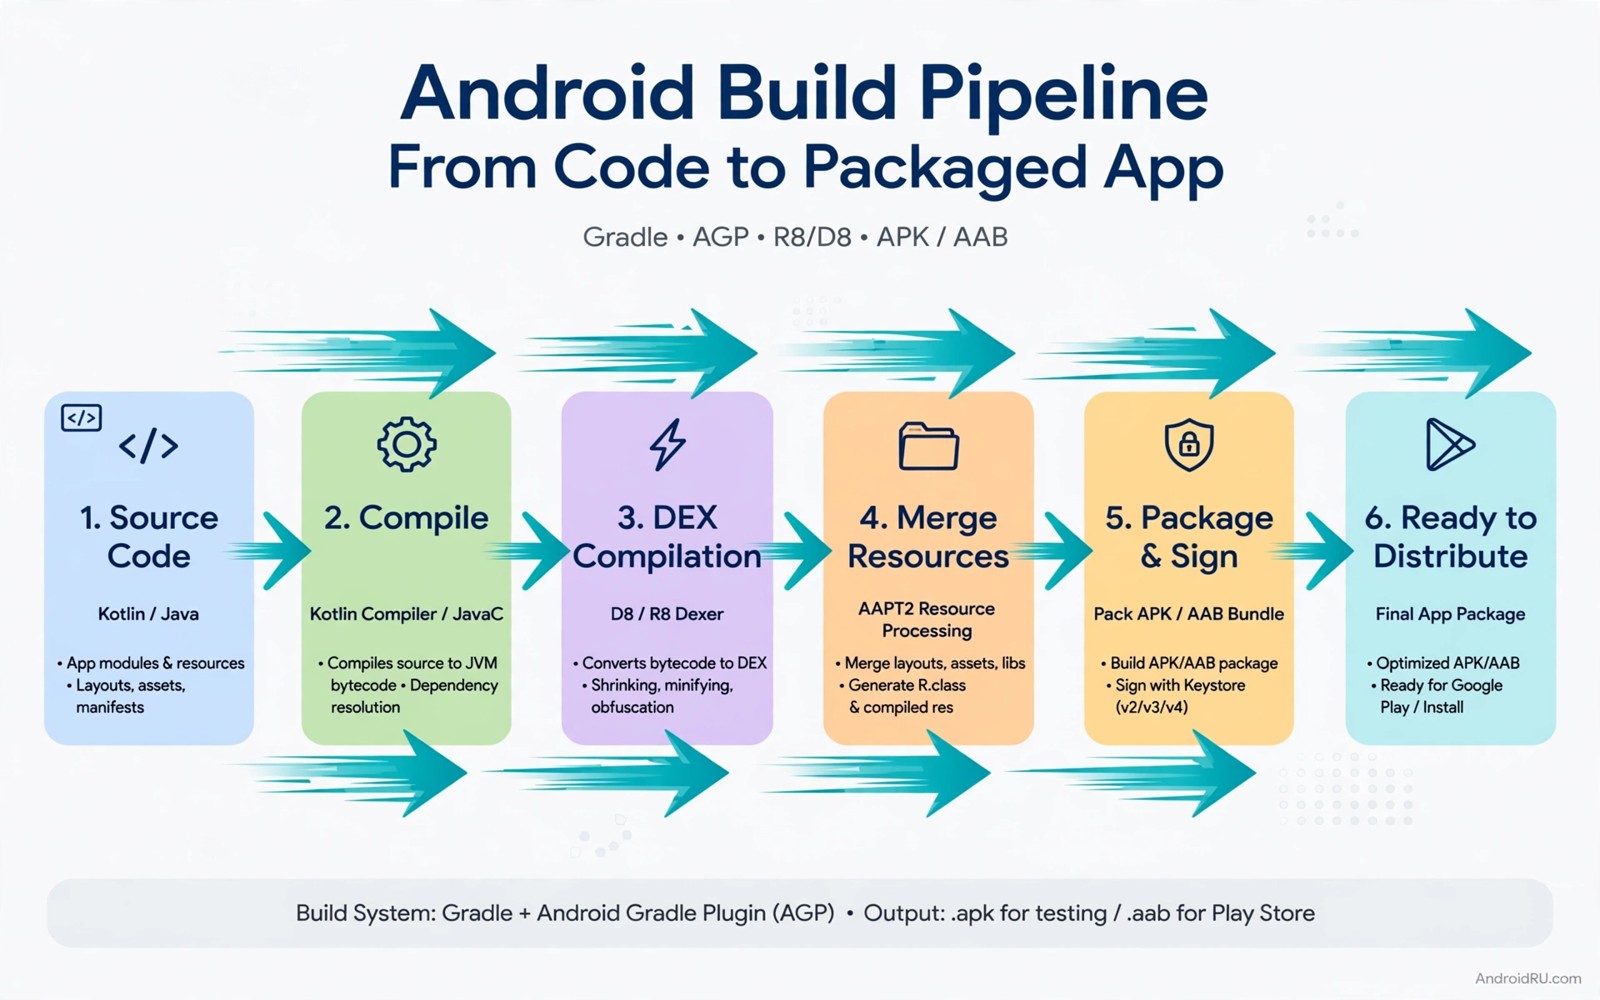
The Secret Way to Optimize Gradle Build Speeds by 50%
A five-minute build feels slow. A five-minute build run ten times a day wastes almost an hour, and that hour is the most expensive kind of waste in software work: it arrives in small slices, it breaks concentration, and nobody puts it on a timesheet. I have watched teams accept slow builds for months because each individual wait felt too small to fix.
Here is the honest version of the headline first. Cutting a build time in half is a realistic target, not a guaranteed result. It depends entirely on where your build starts. A project with no caching, no parallelism, and a tangled dependency tree can improve sharply, sometimes by more than half. A project that already uses caching well will improve less, because the easy wins are already taken. The secret, if there is one, is that the gains come from measurement and a handful of configuration changes, not from a single magic setting.
This guide shows how to optimise Gradle build speeds for your own Android projects. It covers measuring first, configuration cache, build cache, parallel execution, dependency management, modules, and annotation processing. It also warns against shortcuts that break builds, because a fast build that produces a wrong result is worse than a slow build that works correctly.
Why Gradle Build Speed Matters More Than You Think
Build time is a tax on every change. Each edit, each test run, each fix needs a build, and the cost of a slow build compounds across a team. Five developers waiting three extra minutes per build, eight builds a day, lose more than three working hours a day between them. That is a person, gone, to waiting.
Slow builds also change how people work. Developers batch changes instead of testing small steps, because each test costs minutes. They skip running the full build before pushing, because the full build takes too long. They avoid refactoring, because refactoring means rebuilding. A slow build does not just waste time. It quietly trains a team to work more carelessly.
Speed matters for morale too. A feedback loop under a minute keeps a developer in flow. A loop over five minutes breaks it, and the recovery time after each break costs more than the wait itself. When I sped up a project build from around four minutes to under ninety seconds, the change the team noticed most was not the clock. It was that they stopped dreading the build button.
Measure First: How to Find Your Real Build Bottleneck
Guessing is the most common way to waste a week on build speed. A developer who guesses may optimise a small cost and miss the large one, then conclude that nothing helps. Measurement takes twenty minutes and prevents all of that.
Clean build versus incremental build
Start by measuring a clean build and an incremental build separately. A clean build compiles everything from scratch, and it is the number that matters for continuous integration. An incremental build recompiles only what changed, and it is the number that matters for daily development. Most daily work uses incremental builds, so that is usually the number to improve first.
Run each measurement the same way. Close other heavy apps, note the Gradle version and the machine, and run the build at least three times. Take a typical value, not the fastest one, because a single fast run may reflect a warm cache rather than a real improvement. Write the numbers down. You will need them later to prove that a change helped, and to notice when a change quietly made things worse.
Reading a Gradle build scan
Use a Gradle build scan or the profile report to see where the time goes. Run the build with --scan and open the report, or run with --profile and open the HTML report in the build folder. The report breaks time down by task, and the ranking is usually surprising. The task you assumed was slow rarely is, and some quiet task you never thought about is eating a third of the build.
Focus on the largest cost first. A task that takes a large share of time deserves attention even if it looks hard to fix. A task that takes a tiny share can wait even if it looks easy to optimise. That ranking is the whole plan: fix the top three tasks, measure again, and repeat.
The three slowest tasks rule
Write down the three slowest tasks from the report and the time each one takes. Those three are your optimisation list. Everything else is a distraction until those three are handled. After each change, re-run the profile and compare the same three tasks. A consistent improvement across several runs is trustworthy. A single fast run is not.
Configuration Cache and Build Cache Explained
Caching is where the biggest wins usually hide, because it lets Gradle skip work it has already done. Two different caches do two different jobs, and confusing them is the most common caching mistake I see. The configuration cache skips setup work, while the build cache reuses finished task outputs.
What configuration cache actually skips
Configuration cache stores the result of the configuration phase, the part where Gradle reads build scripts and works out the project structure. On later builds it can skip that phase entirely. That saves time on every incremental build, and the saving grows with project size, because large projects spend more time in configuration.
Enable it in gradle.properties with org.gradle.configuration-cache=true, then test that all tasks still work. Some plugins do not support configuration cache yet, and they may need an update or a workaround. Run the full build, run the tests, and run the app on a device. A cache setting that breaks a task should be removed, even if the build looks faster without the broken task running.
Local build cache versus remote build cache
Build cache stores task outputs so Gradle can reuse them when the inputs have not changed. A task that ran before with the same inputs can skip execution and reuse the cached output. That reuse helps most for tasks that are expensive and deterministic, like compilation of an unchanged module.
Enable the local build cache first with org.gradle.caching=true. It lives on your own machine and needs no server. Add a remote cache for a team only when the local cache works reliably, because a remote cache adds setup and maintenance cost. A remote cache pays off when many developers and CI machines build the same code, and it pays nothing when every developer builds different branches all day.
Testing cache correctness after you enable it
Cache correctness matters more than cache speed. A stale cache entry can produce an old result for new code, and that is a bug that looks like nothing is wrong. After enabling a cache, change a source file and confirm the build output changes. Change a resource and confirm the packaged app changes. Change a dependency version and confirm the new version appears. A cache that fails those tests should be disabled until the cause is understood, because a wrong build is worse than a slow one.
Parallel Execution and Worker Settings That Fit Your Machine
Gradle can run independent tasks at the same time, and that parallel execution uses multiple processor cores effectively. Most machines have the cores sitting idle during a single-threaded build, so this is often the cheapest speed gain available.
Enabling org.gradle.parallel
Set org.gradle.parallel=true in gradle.properties. Gradle will then run tasks from different modules in parallel where it can prove they are independent. Test the build after enabling it, because some tasks have hidden dependencies that parallel execution exposes. A task that assumed a strict order may fail when run alongside another task, and that failure is useful information: it means the task was fragile, and the fix is to declare the dependency properly rather than to turn parallelism off forever.
How many workers is too many
Worker configuration controls how many parallel workers Gradle uses, through org.gradle.workers.max. A value that matches the processor core count usually works well. A value far above the core count can cause contention and slower builds, because too many workers fight over memory and disk. A value far below the core count wastes available cores. Test a few values and measure the result for your machine rather than copying a value from another team, because core counts, memory, and disk speed all change the answer.
The Gradle daemon matters here too. The daemon keeps a warm process between builds, so a warm daemon avoids startup cost for each build. Keep it enabled for development with org.gradle.daemon=true. Disable it only in environments where a long-lived process causes problems. A cold daemon on every build adds noticeable overhead to short incremental builds, and it is one of the easiest wins to miss.
Dependencies, Modules, and Task Trimming
Once caching and parallelism are in place, the remaining cost usually lives in the shape of the project itself: what it depends on, how it is split up, and which tasks run on every build.
Pruning the dependency tree
Dependency resolution can slow builds when many versions conflict. A large dependency tree takes time to resolve, and each conflict forces Gradle to work out which version wins. Review dependencies regularly and remove unused ones. Run ./gradlew app:dependencies and look for libraries you no longer use, duplicates pulled in by different modules, and old versions kept alive by a single transitive dependency. A smaller, cleaner dependency tree resolves faster, and it reduces the risk of a runtime conflict.
Update libraries that cause version conflicts instead of working around them with forced versions. A forced version hides the conflict today and creates a stranger bug later, when the forced version and the library that wanted another version disagree at runtime. The dependency tree is a good place to be honest about what the project actually uses.
Splitting modules by feature
Modularisation helps build speed when modules are well separated. Gradle can rebuild only the modules that changed, so a one-line fix in a feature module does not recompile the whole app. A monolithic module forces a rebuild of everything for a small change, and that is the cost that grows with every line of code added.
Split a large app into modules by feature when the boundaries are clear. Avoid over-splitting into tiny modules, because module overhead can offset the benefit: each module adds configuration time and dependency edges. The shape of the split matters too. Module boundaries that speed builds follow the architecture choices compared in the guide to MVVM vs MVI architecture patterns, because a clean separation between UI, state, and data is what lets a module build on its own.
Moving heavy checks to continuous integration
Task trimming means disabling tasks that are not needed for a development build. Lint checks and certain verification tasks are valuable, but they may not need to run on every incremental build. Run them in continuous integration and on release builds. Keep development builds focused on compilation and packaging so the feedback loop stays fast.
Build speed and test speed together set the feedback loop, and the guide to automate mobile app UI tests covers the other half of that loop. A build that finishes in a minute and then runs a twenty-minute manual test pass is still a slow loop. Automating the UI tests and running them in CI, where they can run in parallel with your next change, is what turns a fast build into a fast workflow.
- Remove unused dependencies regularly, and check the dependency tree after every major library update.
- Split a large app into modules by feature, with clear boundaries between UI, state, and data.
- Run heavy verification in continuous integration, and keep local builds focused on compilation.
- Keep development builds focused on compilation and packaging, so the feedback loop stays short.
KSP Versus Kapt and Incremental Annotation Processing
Annotation processing is a quiet build-time cost that many teams never look at. If your project uses code generation, this section may hold your biggest single win.
Why a non-incremental processor hurts
An annotation processor that is not incremental forces a full rebuild of generated code on every change, even when the change touched nothing the processor cares about. A single non-incremental processor can dominate incremental build time while every other task uses caching well. Check each processor’s documentation for incremental support, and update processors that lack it. The build scan will show the cost: look for annotation processing tasks that run on every build and take a large share of time.
Slow queries inside a build test suite deserve the same attention. When generated code or test data involves a local database, the database work itself can become the bottleneck, and the guide to Room database indexing optimization explains how missing indexes turn a fast test into a slow one. A build that waits on unindexed queries is slow for a reason that has nothing to do with Gradle settings.
Migrating one processor at a time
KSP processes annotations faster than kapt for many Kotlin codebases, because it understands Kotlin syntax directly instead of going through Java stubs. Migrating from kapt to KSP needs testing, because generated code may differ in details. Migrate one processor at a time and compare generated output before and after. A measured migration gives a speed benefit without a surprise in generated code, and it tells you exactly which processor was worth the move.
Record the before and after build times for each processor migration. That record helps future developers understand why a processor exists in its current form, and it makes it easier to remove a migration that stops helping after a Gradle upgrade. Each property and each migration should carry its own evidence.
Gradle Properties You Can Adapt for Faster Android Builds
The snippet below is a starting point, not a prescription. Every setting has a trade-off, and every project should test each one separately before committing it.
# Gradle properties for faster Android builds
# Test each setting in your own project before committing it
org.gradle.parallel=true
org.gradle.caching=true
org.gradle.configuration-cache=true
org.gradle.daemon=true
org.gradle.workers.max=8
android.useAndroidX=true
kotlin.incremental=true
Parallel execution needs tasks without hidden order dependencies. Configuration cache needs plugin support. Caching needs deterministic tasks. The workers value above is an example for an eight-core machine, not a universal answer: set it to your own core count and measure. Test the full build after enabling a property and run the app to confirm the output still works. A property that breaks a task should be removed even if it looks faster.
Commit Gradle properties only after a measured improvement. Record the before and after build times in the commit message or in the project notes. That record is what stops the next developer from removing a setting they do not understand, and it is what lets you spot a setting that stopped helping after a Gradle upgrade.
Comparing Gradle speed techniques side by side
Not every technique pays off equally, and the right order is to take the large, cheap wins before the small, expensive ones. This table puts the trade-offs in one place so you can choose where to start.
| Technique | What it changes | Typical gain | Main risk |
|---|---|---|---|
| Build cache | Reuses task outputs | Large on repeat builds | Stale outputs if tasks are not deterministic |
| Configuration cache | Skips the configuration phase | Moderate, grows with project size | Plugins without support can break |
| Parallel execution | Runs independent tasks together | Moderate on multi-core machines | Exposes hidden task dependencies |
| Dependency pruning | Smaller resolution tree | Small to moderate | Removing a dependency something still needs |
| Module splitting | Rebuilds only changed modules | Large on big codebases | Over-splitting adds overhead |
| KSP over kapt | Faster annotation processing | Moderate on Kotlin projects | Generated code differences need checking |
| Moving checks to CI | Shorter local builds | Moderate locally | Issues found later if CI is slow |
Read the table as a priority list, not a shopping list. Start at the top, measure, and stop when the build is fast enough. The goal is a feedback loop that feels instant, not a perfect score on every row. A build that drops from five minutes to two and a half has hit the headline target, and it got there with caching and parallelism alone in most projects I have worked on.
Common Mistakes That Waste the Time You Just Saved
Speed work fails in predictable ways. These are the three I see most often, and each one is easy to avoid once you know to look for it.
Enabling every speed property at once
Several changes at once make it hard to tell which one helped and which one broke a task. Enable one property at a time and test the build after each change. A slow cycle gives a clear result, while a fast cycle gives confusion. When something breaks, you will know exactly which change to revert, and when something helps, you will know exactly which change to keep.
Disabling every check for speed
Lint and tests catch bugs that a fast build would ship. Keep checks in continuous integration even when you skip them for local development. A fast local build and a thorough integration build together give speed and safety. A fast local build with no checks anywhere gives speed and regret, usually within a week.
Tuning only on the fastest machine
A build that is fast on a high-end machine may still be slow on a typical developer laptop. Measure on the machines the team actually uses, including the oldest one. A speed improvement that only helps one machine is not a team improvement, and a setting tuned for sixteen cores can hurt on four. The slowest machine on the team is the one that sets the real build time.
A final Gradle check should test the build on a clean checkout rather than only on a developer machine with a warm cache. A clean checkout reveals a missing dependency or a task that assumed a cached output. Clone the project to a fresh folder and run the build there. Compare the clean build time with the warm build time. A large gap between the two points to cache dependence that continuous integration will also face, and CI machines usually start cold.
Frequently Asked Questions About Gradle Build Speed
Can Gradle build speed really improve by 50 percent?
It depends on the starting point and the bottlenecks. A project with no caching and no parallelism can improve sharply, and halving the build time is a realistic target there. A project that already uses caching well will improve less, because the easy wins are already taken. Measure your own baseline before promising a specific percentage for your project, and treat 50 percent as a goal to test against, not a figure any guide can guarantee for every codebase.
Is configuration cache safe for all Android projects?
Most modern projects support it, but some plugins do not yet. Test the full build and the app after enabling it. Check plugin documentation for configuration cache support, and disable it for a task or plugin that breaks until an update fixes support. The Gradle team keeps a compatibility list, and it is worth checking before you enable the setting on a large project.
Should I use a remote build cache for a small team?
Start with a local cache for each developer. Add a remote cache when the team shares many identical builds and the local cache works well. A remote cache adds setup and maintenance cost that a small team may not need at first, and it only pays off when several people build the same code. For a team of two or three on different features, the local cache usually gives most of the benefit.
Why is my first build after a change still slow?
The first build after a change is slow for honest reasons: the changed module must recompile, its dependents must recompile, and annotation processors may regenerate code. Caching helps repeat builds, not first builds after a real change. If the first build after a one-line change takes nearly as long as a clean build, the cause is usually a module that is too large or a non-incremental processor, and those are the places to look.
Does a faster build change the app itself?
No, as long as the optimisation is correct. Caching, parallelism, and module splits change how the build runs, not what it produces. That is why the correctness checks matter: change a source file and confirm the output changes, change a resource and confirm the packaged app changes. If the output is identical, the speed gain is free. If it is not identical, the cache or the setting is wrong, and speed is the wrong thing to celebrate.
Your Next Step: Measure, Change One Thing, Measure Again
Gradle build speed improves through measurement, caching, parallelism, and clean dependencies. Each optimisation needs a test to confirm the build still produces a correct app. A fast build that breaks tasks is not an improvement. A measured improvement that survives several runs and a real device test is a real win for the whole team.
Open your project today and measure a clean build and an incremental build, then record the slowest three tasks. Enable one optimisation for the slowest task and measure again. That single cycle will show whether a larger optimisation effort is worth the time, and it gives you a baseline that every later change can be judged against. The 50 percent target is reachable for many projects, but only the projects that measure will ever know they reached it.

