

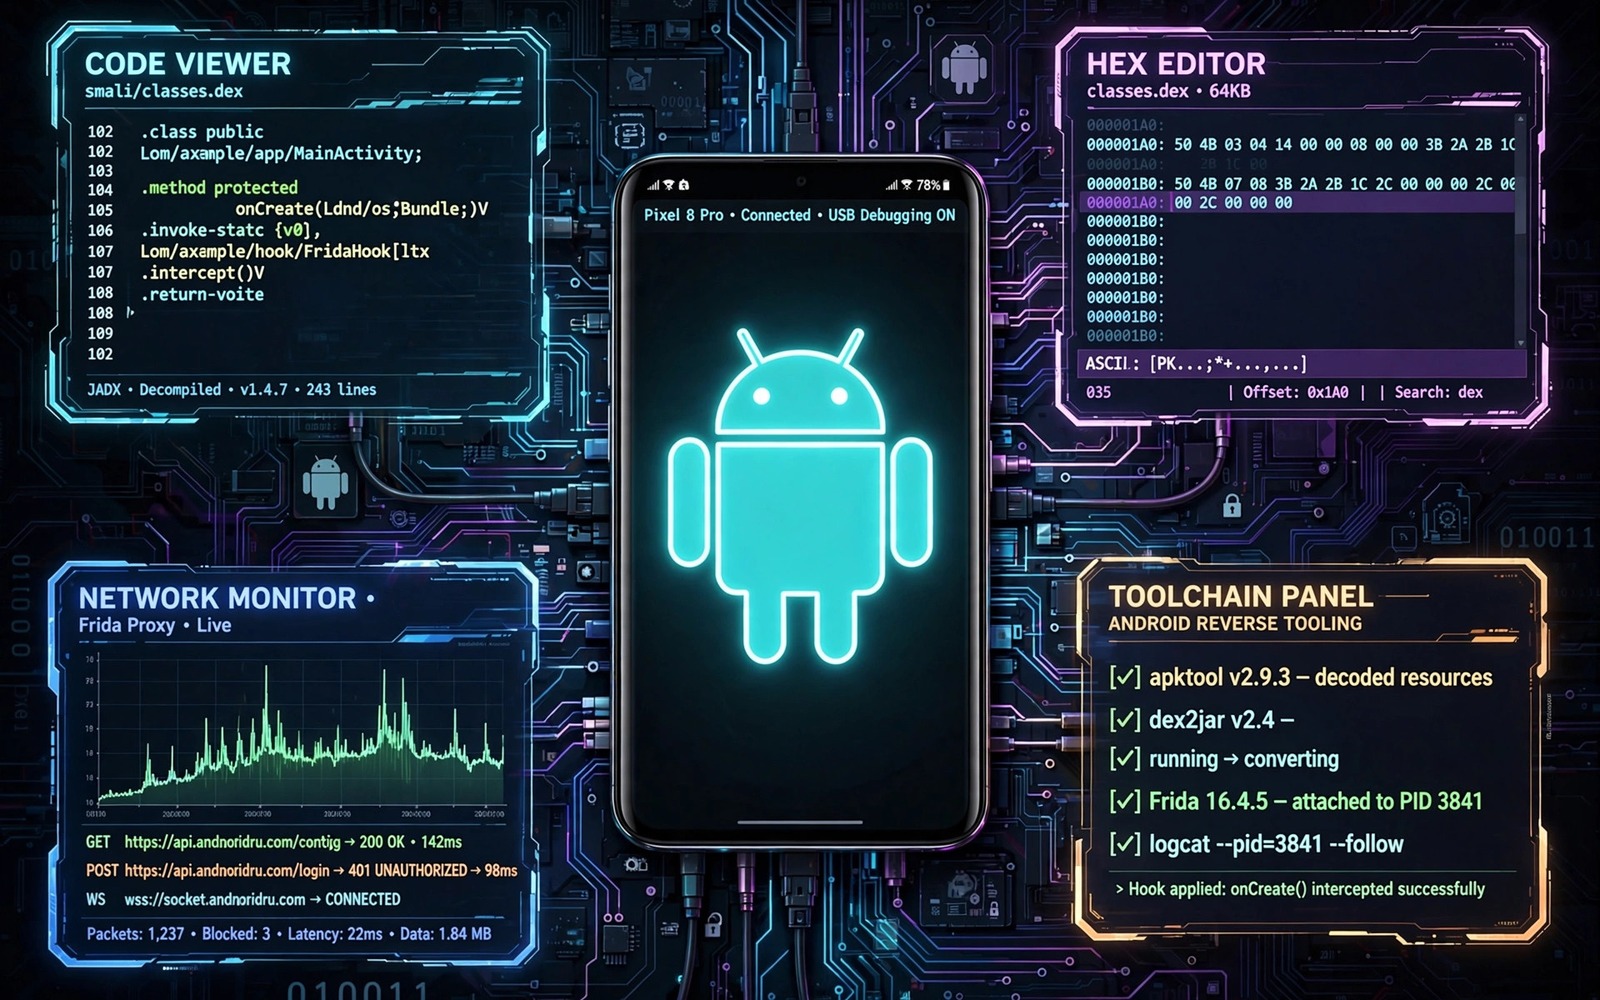
Reverse engineering an Android app becomes much easier when you have a small set of reliable tools. Each tool answers a different question about a package. One tool shows code structure and another tool shows resources. A third tool shows network behaviour while the app runs. Together they give you a full picture without guesswork. This guide explains ten tool types that cover most analysis work.
Start with tools that you can run on your own apps first. Learn the basic controls before you study a complex package. Keep each tool updated and keep test output in separate folders. A clean setup prevents confusion when results differ between tools. It also helps you repeat an analysis later with the same steps.
A good starting point is a decompiler that turns DEX code into readable Java-like code. Pair that decompiler with a resource viewer that shows layouts and strings. Add a manifest reader so you can see activities and permissions at a glance. These three views form the core of static analysis. Most questions about app structure can be answered from those views alone.
Start With Code And Resource Viewers
A code viewer should let you search across classes and jump to method calls quickly. Search is the most valuable feature because packages can hold thousands of classes. Use search terms from the user interface such as login or upload or sync. The search results will point to the classes that handle those features. Open one class at a time and follow the calls in order.
A resource viewer should show layouts in a tree form and strings in a searchable list. Layout trees reveal screen structure without running the app. String lists reveal feature names and error text. When a string matches a screen label you can trace that string back to the layout and then to the code that loads it. This chain is a reliable way to map a feature from screen to code.
- Use a decompiler for DEX code and method flow
- Use a resource viewer for layouts and strings
- Use a manifest reader for activities and permissions
- Use a file viewer for native libraries and assets
- Use a diff tool to compare two app versions
Add Smali And Bytecode Tools
Smali is the readable form of DEX bytecode. A Smali viewer helps when decompiled Java code hides detail or looks unclear. Smali shows the exact instructions that the device runs. It also shows registers and method calls in a direct form. Learning basic Smali reading improves your accuracy when you study security checks or tricky logic.
Keep a Smali editor for small patches on your own test builds. A patch should change one behaviour at a time so you can test the result clearly. Record the original instruction before you change it. Test the patched build on a test device or emulator and note any crash or change in behaviour. Small careful patches teach more than large rushed changes.
For a focused walkthrough of package inspection you can read the material on decompiling and inspecting APK files before you add Smali tools to your setup. That walkthrough shows how code and resource views fit together in a short routine. Use it as a base and then add Smali reading as a second layer when decompiled code leaves a question unanswered.
Use Dynamic Analysis Tools
Static views cannot show every behaviour of an app. Dynamic tools watch the app while it runs and record what it does. A runtime monitor can log method calls and file access and network requests. These logs show the order of events during a real user flow. They also reveal code paths that static views miss because of dynamic loading.
Set up a test device or emulator that you can reset easily. Install only the app that you study and the monitoring tool that you need. Run one user flow at a time and save the log for that flow. Label each log with the flow name and the app version. Clean logs make it easy to compare behaviour before and after a change.
Dynamic work pairs well with the practical material on proxy traffic inspection because network logs often explain data flow that code alone hides. Combine runtime logs with code reading to confirm a theory. A log entry that matches a method call gives you strong evidence. A mismatch tells you to look for another code path.
Inspect Network And Storage Behaviour
Network tools show requests and responses between the app and servers. They help you see which data leaves the device and when it leaves. Use them only on your own apps or on test servers that you control. Record request paths and response codes and data sizes. These details help you judge whether an app sends more data than its feature needs.
Storage tools show files that the app creates on the device. Check cache folders and database files and shared preferences. A database file can reveal how the app stores user data locally. A preference file can reveal settings and flags that control features. Copy test data to a safe folder before you open it so the original state stays intact for repeat tests.
Compare Versions And Track Changes
Version comparison is one of the most useful skills in reverse engineering. A diff tool can show which classes changed between two builds. It can also show which resources changed and which permissions were added. Start a comparison from the manifest and then move to the code classes that changed most. This order keeps the work focused on real changes.
Record each change in plain words and note whether it affects a user-facing feature. A permission change may affect privacy. A new library may affect performance. A changed method may fix a bug or add a feature. A short change log for each version helps you and other developers understand the history of an app without re-reading every file.
Build A Portable Toolkit
A portable toolkit lives in one folder with clear subfolders for each tool type. Keep a readme file that lists the purpose of each tool and the command that starts it. Keep a separate folder for test APK files and a separate folder for output. This structure makes it easy to move the toolkit to a new computer. It also makes it easy to share the setup with a teammate.
Test your toolkit on a small app that you built yourself. A small app gives you known code to compare against tool output. If the tool output matches your known code then you can trust the tool on unknown packages. If the output differs then you learn the limits of the tool before you rely on it for important work. This test step is short and it prevents many errors later.
tools/
  decompiler/
  resource_viewer/
  smali_editor/
  network_monitor/
  output/
The snippet above is an original example written for this guide. It shows a generic folder layout that you can adapt to your own toolkit. It does not copy code from any outside source.
Use the layout as a starting point and rename folders to match the tools that you install. Keep output folders separate from tool folders so updates do not delete your work. Back up the toolkit folder before you upgrade a tool that changes its output format.
Document Tool Output For Teammates
Tool output becomes useful to a team only when it carries context. A decompiled method without a note about its purpose is hard for a teammate to use. A network log without a flow name is hard to interpret days later. Add a short header to every output file that states the app name and version and the tool used and the question that the output answers. A header takes seconds to write and it saves hours of rework when someone revisits the file. It also prevents a file from one app being mistaken for a file from another app.
Use consistent file names across a project so teammates can find output quickly. A name that includes the app version and the tool name and the date sorts well in a folder. A name that says only output or test is useless after a week. Keep a single index document that lists every output file and its purpose. Update the index at the end of each analysis session rather than at the end of a long project. Frequent updates keep the index accurate.
Review documentation with the same care as tool output. Ask a teammate to follow your notes and reproduce one finding without your help. A finding that a teammate can reproduce is well documented. A finding that needs your explanation is missing context. Fix the missing context before you move to the next task. Documentation quality is part of analysis quality and it deserves the same attention as tool choice.
Common Mistakes
A common mistake is installing every tool at once and learning none of them well. A large toolkit looks impressive but it slows real work. Start with three core tools and add one tool only when a task needs it. Depth with a few tools beats shallow use of many tools.
Another mistake is running analysis tools on apps without permission. Study your own apps and apps that you have clear permission to study. Respect licences and do not use tools to copy paid features or to break protections on apps that you do not own. Ethical limits keep your skills useful and your work defensible.
Some analysts also trust one tool output without cross-checking. Decompilers can misread complex code and resource viewers can hide detail. Compare important findings across two tools before you act on them. A second view often reveals a detail that the first view missed.
Finally do not store test output and original APK files in the same folder. Mixed folders create version confusion and lost files. Use dated folders for output and keep original files read-only when possible. This habit keeps long projects organised.
Frequently Asked Questions
How many tools do I need to start?
You need three core tools to start. A decompiler and a resource viewer and a manifest reader cover most static work. Add dynamic tools later when you need runtime behaviour.
Do I need a rooted device for reverse engineering?
You do not need a rooted device for static package analysis on a computer. Root access helps some dynamic monitoring on a device but it is not required for code and resource study.
Can these tools replace reading code by hand?
Tools speed up reading but they do not replace judgement. You still need to follow logic and verify findings across views. A tool shows data and you decide what the data means.
Conclusion
A strong reverse engineering toolkit is small and focused and well tested. Start with code and resource viewers and then add Smali and dynamic tools as your tasks grow. Keep output organised and cross-check important findings. Your concrete next step is to set up three core tools today and test them on an app that you built yourself. Record which view answered each question and then add one new tool next week based on a real gap. For performance context you can also study Kotlin performance fixes and for protection topics you can study app signature verification as follow-up reading.

