

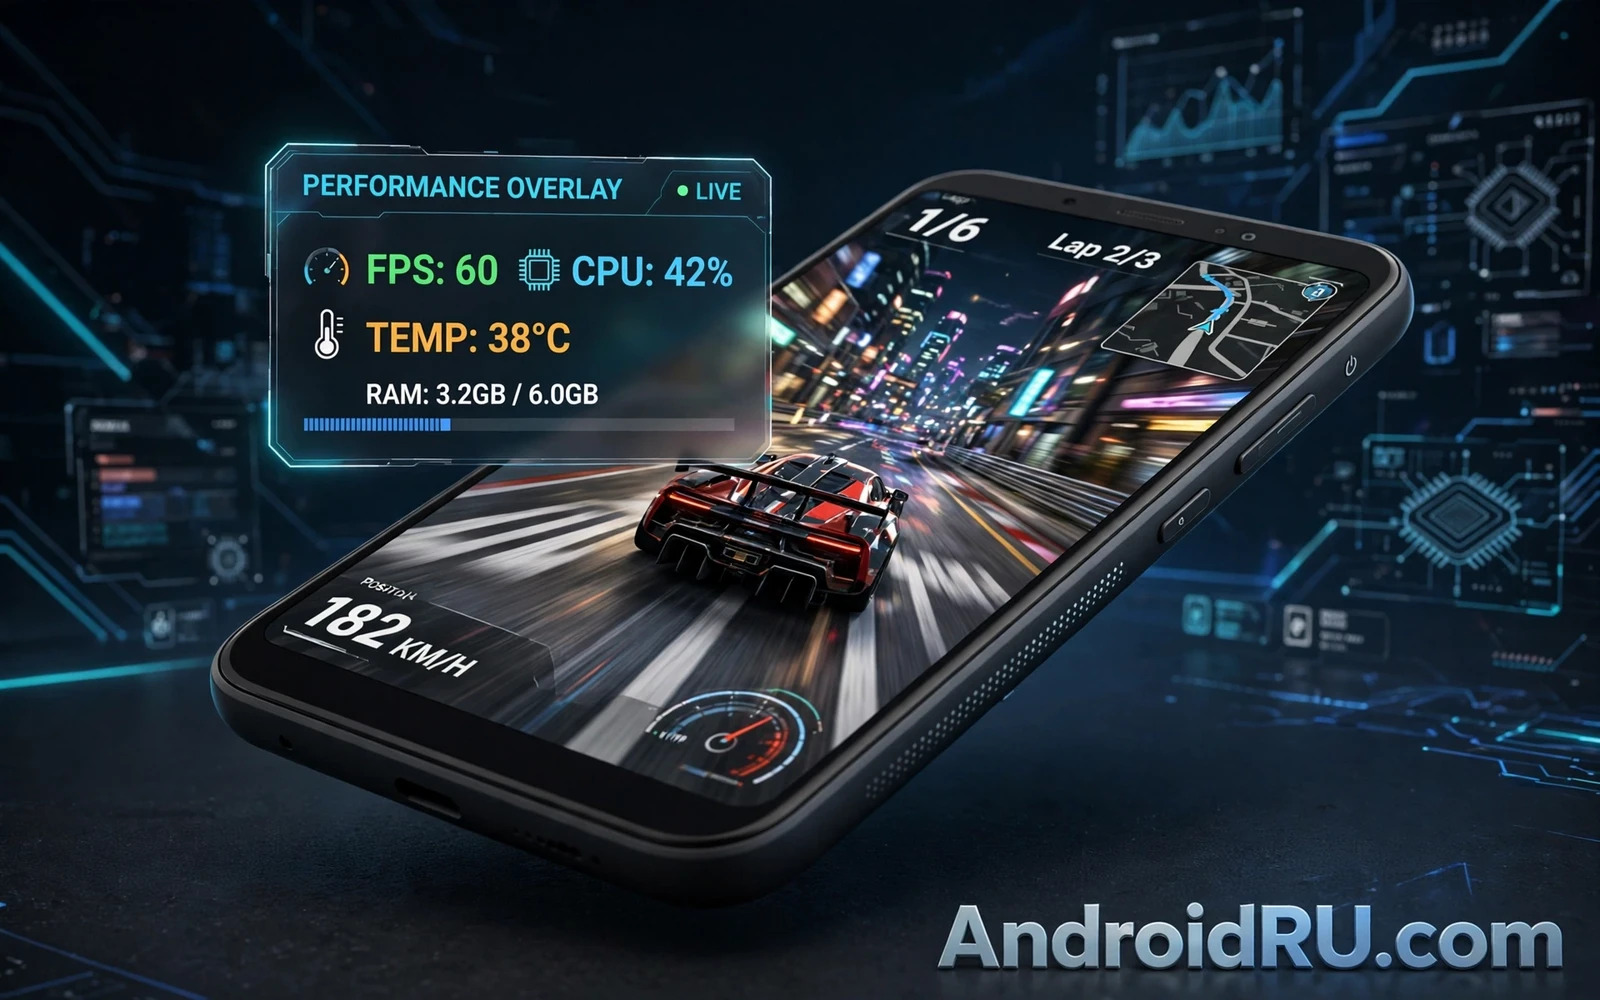
How to Use Performance Overlay Monitors on Android Games
A performance overlay puts live numbers on your game screen. Frame rate shows how smooth play feels. Frame time shows stutters that an average can hide. Temperature shows when heat may soon slow your phone. Memory use shows when a game is pushing its limits. Reading those numbers well turns guessing into tuning: you change one setting and see the result in the next minute, not in a vague feeling after a week.
I started using overlays because a game I liked felt fine in menus and rough in fights, and I could not tell whether the problem was my phone, my settings, or my connection. One session with an overlay answered it in ten minutes. The frame rate was steady at 60 in quiet scenes and dropped to 34 whenever effects filled the screen. That told me the graphics settings were the problem, not the network, and lowering two settings fixed it. This guide shows you how to get that same answer for your own phone and your own games.
Overlays are tools for testing rather than for permanent play. Use them to learn your phone, use them to settle a graphics choice, then turn them off and enjoy the game. The numbers should serve your fun rather than replace it.
What a performance overlay shows while you play
The core appeal of a performance overlay is simple: FPS and system stats on screen, live, while you play. FPS, or frames per second, is the headline number. A game running at 60 FPS draws a new image sixty times a second. At 30 FPS it draws half as many, and motion looks choppier. At 90 or 120 FPS on a high refresh rate screen, motion looks clearer still, provided the phone can sustain it without overheating.
Frame time is the number most new users ignore, and it is the one that explains the stutters you feel but cannot see in an average. Frame time is how long each single frame took to draw, measured in milliseconds. At a steady 60 FPS, each frame takes about 16.7 milliseconds. If most frames take 16 milliseconds and a few take 50, the average still looks close to 60, but your eyes notice those slow frames as hitches. Watch frame time as well as average FPS, and you will spot the real problem.
FPS, frame time and why the average can mislead you
Temperature, CPU load, GPU load, and RAM use fill out the picture. A phone that starts a session at 58 FPS and ends it at 38 FPS is usually throttling: the chip got hot, the system lowered its speed to protect itself, and the game slowed down with it. Battery temperature is the reading to watch here, and on most phones a battery temperature above 43 to 45 degrees Celsius during play is a sign that heat is becoming the limit, not the game itself.
RAM use matters in a different way. A game that keeps climbing toward the limit will eventually force the system to close background apps, and on a phone with 6 GB of RAM or less it can even reload the game when you switch away for a moment. If free RAM sits near zero and the game stutters when you open a map or a menu, memory pressure is a likely cause. Show only three or four stats to avoid clutter: FPS, frame time, temperature, and one of CPU or RAM. A screen covered in numbers is harder to read in a fight than a clean one with four clear readings.
Choosing an overlay tool for your phone
Start with the tool your phone already has. Most gaming phones and many ordinary phones now ship a built-in game tool that includes an overlay, and it costs nothing, needs no extra permission, and cannot get your account in trouble. Samsung phones have Game Booster inside Game Launcher. Xiaomi, Redmi, and Poco phones have Game Turbo. ASUS ROG phones have Armoury Crate and its Game Genie overlay. OnePlus has a Games app with a similar panel, and Realme has Game Space. If your phone has one of these, try it first for a week before you install anything else.
Built-in tools usually show FPS, temperature, CPU and GPU load, and sometimes network latency, in a small panel you can drag to a corner. They also bundle useful extras: blocking notifications during play, locking brightness, and recording the screen. Their weakness is detail. A built-in overlay may show only an average FPS number and no frame time graph, which is exactly the detail you need to find stutters. That is when a third-party tool earns its place.
Built-in game tools from Samsung, Xiaomi and ASUS
On a Samsung phone, open Game Launcher, start a game, then swipe in from the side or tap the floating Game Booster icon to open the panel. Look for the performance monitor or FPS display option and turn it on. On Xiaomi, open the game through Game Turbo, pull the sidebar in from the edge of the screen, and enable the performance monitor there. On an ASUS ROG phone, open Armoury Crate, pick the game, and enable the real-time information overlay in the Game Genie settings. The names differ, but the pattern is the same: the game tool lives in a sidebar or a floating icon, and the overlay is a toggle inside it.
These tools are safe to use in online games because they come from the phone maker and they only read system stats. They do not read the game memory or change how the game runs. For a related setup idea you can explore optimizing Android for smoother gaming during your next break, because an overlay tells you what is wrong and that guide covers the settings that fix it.
Third-party overlay apps and what they need to run
Third-party overlay apps fall into two groups. The simple ones, such as CPU Float and DevCheck, float a small window with CPU, GPU, temperature, RAM, and sometimes FPS, and they need only the “display over other apps” permission. They are easy to set up, but their FPS reading on many phones is an estimate, because Android does not hand every app a clean frame rate number. The deeper ones, such as Takostats and GameBench, can show a true frame time graph, but they need a one-time setup over ADB or Shizuku to read the system frame data.
GameBench is worth knowing about because it was built for this exact job: it records a session, draws an FPS and frame time graph, and lets you review the session afterwards. Takostats is a popular free choice in the same style, with a floating FPS meter and a graph you can read while playing. Scene and Franco Kernel Manager are aimed at users who already tinker with kernels and want per-core CPU frequency and detailed thermal data as well. PerfMon+ is another lightweight floating monitor for CPU, GPU, and temperature. Avoid overlay tools that ask for risky permissions, such as accessibility access they do not need, device administrator rights, or the ability to draw over a banking app. A monitor only needs to draw over games and read system stats. Anything beyond that is a reason to pick a different app.
ADB and Shizuku setup in plain terms
ADB is the Android Debug Bridge, a tool on a computer that can grant a permission to an app on your phone once, after which the app keeps it. Shizuku is an app that does the same job from the phone itself, using wireless debugging on Android 11 and above, so you do not need a computer after the first setup. The usual flow is: enable Developer options by tapping the build number seven times in Settings, then About phone, then turn on USB debugging or Wireless debugging, then connect the app through Shizuku or through an ADB command from a computer. The overlay app then shows its setup as complete. You do not need to root the phone for any of this, and you should not grant an overlay app root access unless you fully understand what it will do with it.
Setting up your first overlay in ten minutes
Here is a setup you can follow tonight, with a built-in tool or with Takostats as the example. The steps are short, and each one has something to check before you move on.
- Pick your tool. If your phone has a built-in game tool, use it. If not, install Takostats or CPU Float from Google Play and grant only the “display over other apps” permission when asked.
- Open the overlay settings and choose four stats: FPS, frame time, battery temperature, and RAM use. Turn everything else off for now. A clean overlay is a readable overlay.
- Set the text size to a level you can read at a glance without leaning in, and set the position to a corner that never covers a game button. Top left works for most games. Set the background to a dark, partly transparent box so the numbers stay readable over bright scenes.
- Start a game you know well, play one full match or one mission, and watch the numbers at three moments: the menu, a quiet scene, and the busiest fight. Write the three FPS readings down. If they are far apart, you have found your tuning target.
- Turn the overlay off for your next relaxed session. You now know the numbers, and the game deserves your full screen.
Test in the same game scene before and after a change. That is the rule that makes every later test honest. If you test a quiet menu before a change and a boss fight after it, the numbers will differ because the scene differs, not because the setting worked. Pick one repeatable scene, such as the first minute of a match on the same map, and use it for every comparison.
Picking three or four stats and placing them on screen
Place the overlay where your thumbs never go and where the game never puts a critical button. On most phones that is the top edge, left or right corner. Keep the font large enough to read in a glance and small enough that it covers less than a tenth of the screen. If the overlay has a graph mode, use it for frame time: a flat line means steady play, and spikes you can see are stutters you can feel. A number alone cannot show you a spike that lasted half a second.
Text size, position and opacity that stay out of the way
Set opacity to around 60 to 70 percent for the background box, so the numbers stay readable without blocking the scene behind them. If the overlay lets you hide it with a quick toggle or a floating button, turn that on: you will want to hide the numbers during a cutscene or a quiet moment without digging through settings. On a small phone, two lines of text beat four lines every time, so put FPS and frame time on the first line and temperature and RAM on the second.
Reading FPS, frame time, temperature and RAM like a tester
Reading an overlay is a skill, and it improves fast once you know what each number is telling you. Start with FPS. If a game offers a 60 FPS mode and your overlay shows a steady 59 to 61, the phone is keeping up. If it shows 45 to 55 with constant movement, the phone is struggling to hold the target, and a lower graphics setting will usually steady it. If it shows a locked 30, check whether the game itself is capped at 30 in its settings, because no overlay can fix a cap the game imposed.
Frame time is the second reading, and it is the honest one. A frame time graph that stays near 16.7 milliseconds is a smooth 60 FPS session. A graph that jumps between 16 and 33 milliseconds is a session with regular hitches. A single spike to 80 or 100 milliseconds is a freeze you felt as a stutter. When you see spikes, note what was happening on screen: an explosion, a new area loading, or a notification arriving. The cause is often visible in the same second as the spike.
What a healthy frame time graph looks like
A healthy graph is a flat line with small wobbles. It does not need to be perfectly flat, and a few small spikes at a loading screen are normal. What you are looking for is a pattern: spikes every few seconds, spikes whenever you turn the camera, or a graph that slowly climbs as the session goes on. Spikes on camera turns often point to a texture or shadow setting. Spikes that grow over time often point to heat building up. Spikes at random moments often point to a background app waking up, and closing background apps before a session is the cheapest fix there is.
On a 120 Hz screen, the healthy numbers change. A steady 120 FPS means a frame time near 8.3 milliseconds, and a steady 90 FPS means about 11.1 milliseconds. A useful companion read is enabling a high refresh rate in supported games, which covers how to turn the higher rate on in games that support it, because an overlay that shows 60 FPS on a 120 Hz phone may simply mean the game never asked for more.
Temperature, throttling and battery drain
Battery and heat matter on a phone in a way they never do on a console. Long sessions drain power and raise temperature, and a phone that gets hot will slow itself down to stay safe. Watch the battery temperature reading over a 20 minute session. If it climbs past 43 degrees and the FPS starts to fall at the same time, you are watching thermal throttling happen live. A sensible player lowers brightness a little, removes a thick case during a long session, and takes a short break between runs. Those small habits protect both performance and battery health over time.
Battery drain is the other half of the same story. An overlay that shows a high GPU load and a falling battery percentage is telling you the game is working the phone hard. Lowering the resolution scale or the shadow quality usually cuts both heat and drain at once, which is why those two settings are the first ones experienced players reach for. If the phone is nearly full on storage as well, the system has less room to work, so free up space before a long session: delete games you no longer play and move photos to a backup when storage gets tight.
Using overlay data to tune graphics settings
Tuning with an overlay is a loop: measure, change one thing, measure again in the same scene, and keep the change only if the numbers improve. The discipline is in the words “one thing”. If you lower shadows, resolution, and effects all at once and the FPS improves, you have no idea which change did the work, and you may have lowered a setting that cost you visual quality for nothing.
Start with the settings that cost the most performance for the least visible gain. Shadows are usually first: dropping shadow quality from high to medium often buys a large FPS gain with a small visual change. Resolution scale is second: dropping from 100 percent to 85 or 90 percent is hard to notice on a phone screen and easy to measure on the overlay. Anti-aliasing is third, because on a small, dense phone display its benefit is smaller than on a large monitor. Effects quality, such as particles and bloom, comes after that, and it matters most in games with heavy combat effects.
Change one setting, test the same scene, compare
Run the test like this. Play your repeatable scene for two minutes with the overlay on and note the average FPS, the worst frame time spikes, and the battery temperature at the end. Change one setting. Play the same scene again for two minutes and note the same three numbers. If the FPS rose by five or more and the spikes shrank, keep the change. If nothing changed, put the setting back and try the next one. Keep a short note of each test, even a single line in a notes app, because after three changes you will not remember which setting did what, and the note is what turns guessing into a method.
A simple before-and-after test you can repeat
Pick a scene you can repeat exactly: the opening minute of a match, a training mode run, or a fixed route through a game world. Play it once, write the numbers down, change one setting, and play it again. Use the same brightness, the same case on or off, and the same background apps closed, so the only difference is the setting you changed. Two runs per setting is enough for most decisions. If the two runs disagree by a lot, run a third and take the middle value.
Overlay tools compared: built-in versus third-party apps
No single overlay tool is best for every player, because the right choice depends on your phone, your games, and how much detail you want. A built-in tool is the easiest start. A simple floating monitor is the easiest way to watch temperature and RAM. A deep tool with a frame time graph is the best way to find stutters. The table below compares the common choices on the criteria that matter in daily use.
| Tool | Setup needed | FPS and frame time | Best for |
|---|---|---|---|
| Samsung Game Booster | None, built in | FPS average, limited graph | Samsung owners who want zero setup |
| Xiaomi Game Turbo | None, built in | FPS average, temperature | Xiaomi, Redmi and Poco owners |
| ASUS Armoury Crate | None, built in | FPS, temperature, CPU and GPU load | ROG phone owners and long sessions |
| Takostats | ADB or Shizuku once | True FPS and frame time graph | Finding stutters in any game |
| GameBench | Account and setup once | FPS graph with session recording | Reviewing a full session afterwards |
| CPU Float | Draw-over-apps permission | Estimated FPS, full system stats | Quick temperature and RAM checks |
| DevCheck | Draw-over-apps permission | System stats, limited FPS | Hardware detail alongside play |
If this section raises a question about which phone handles heat best in the first place, you may find an answer in gaming phones tested for cooling and battery before you change a setting, because a phone with better cooling will hold its FPS longer in the same game, and no overlay setting can give a hot phone the cooling it does not have.
Which tool fits which player
A casual player who wants to know whether a game runs well should use the built-in tool and stop there. A player who feels stutters but sees a good average FPS should use Takostats or GameBench, because only a frame time graph will show the spikes. A player who tweaks kernels or follows chip temperatures closely will get more from Scene or Franco Kernel Manager, but that level of detail is not needed to tune graphics settings. Pick the simplest tool that answers your question, and only move to a deeper tool when the simpler one leaves a question unanswered.
Overlays during online play and competitive games
Overlays that only read system stats are generally fine in online games, because they do not touch the game itself. Built-in game tools fall in this group, and so do floating monitors such as CPU Float and DevCheck. They show you numbers about your phone, and the game cannot tell the difference between an overlay and a chat bubble on screen.
That said, competitive games have rules, and the rules are written by the game maker, not by the overlay maker. Some games block third-party overlays from drawing over them, and some anti-cheat systems treat any app that reads frame data with suspicion. If a game warns you about an overlay, or if the overlay stops working when a match starts, turn the overlay off for that game rather than fighting the warning. Avoid shortcuts that promise instant progress, and avoid any overlay that claims to change game files, reveal hidden information, or boost your rank. Unofficial downloads can carry malware, altered files can lead to a banned account, and the safer path keeps your device and your account intact.
Rules, fair play and permissions to avoid
Before a ranked session, check two things. First, does the game allow overlays, or does its own settings page say to close them? Second, does your overlay ask for any permission beyond drawing over other apps and reading system stats? If the answer to the second question is yes, remove that overlay and pick a simpler one. A monitor never needs access to your contacts, your messages, or your files, and a tool that asks for those permissions is not a monitor you should trust.
Common mistakes, glitches and fixes
Most overlay problems have a short fix, and most of them come from one of four causes: a missing permission, a setting the game overrides, a phone feature that hides the overlay, or a reading that was never accurate in the first place. Work through them in that order and you will solve most cases in a few minutes.
Time management is a skill here just like any in-game skill. Long sessions without breaks lead to slower reactions and poorer choices, and the overlay can make that worse if you stare at the numbers instead of the game. Set a timer if you tend to lose track of time, stop at a natural break point, and return later with fresh eyes. Short sessions with clear goals lead to steadier progress than one long session that ends in frustration.
Why an overlay shows 0 FPS or disappears
An overlay that shows 0 FPS usually cannot read the frame data on your phone, and the fix depends on the tool. For a built-in tool, restart the game and open the overlay again from the game sidebar. For Takostats or a similar tool, check that the ADB or Shizuku permission is still granted, because a reboot or an update can clear it, and run the setup step once more. For a simple floating monitor, remember that its FPS number is an estimate on many phones, so a zero may mean the estimate failed, not that the game stopped.
An overlay that disappears mid-game is usually being closed by the system to save memory, or hidden by a full-screen mode. Lock the overlay app in the recent apps list so the system does not close it, turn off battery optimisation for the overlay app in Settings, then Apps, then the app name, then Battery, and check that the game is not running in a full-screen mode that hides floating windows. An overlay that shows a temperature far above the real value may be reading a sensor that sits near the chip rather than the battery, so compare it with the battery temperature reading and trust the battery figure for throttling decisions.
Updates can change an overlay or a game in ways that need a fresh look at your old habits. A game update can change a graphics setting name, reset your settings to a default, or add a new mode that performs differently. Read update notes when they arrive, test your old approach after a big update, and adapt early rather than clinging to a method that no longer works. Sound and visual settings deserve the same careful test: change one setting at a time, play a full session with that change, and judge the result by feel as well as by the numbers.
Frequently asked questions about performance overlays
What is the best overlay app for Android games?
There is no single best choice for every phone. Use the built-in game tool if your phone has one, because it needs no setup and cannot cause account trouble. Use Takostats or GameBench if you need a true frame time graph to find stutters. Use CPU Float if you only want temperature, CPU, and RAM in a small floating window. The best setup depends on your phone, your games, and whether you need a graph or just a number.
How do I read frame time on a performance overlay?
Frame time is the time one frame took to draw, in milliseconds. At 60 FPS the target is about 16.7 milliseconds per frame. A flat graph near that value means smooth play. Repeated spikes to 33 milliseconds or higher mean hitches you can feel, even when the average FPS looks fine. Look for patterns in the spikes, such as camera turns or explosions, because the pattern points to the setting or the cause.
Can a performance overlay slow down my game?
A light overlay costs very little, usually far less than one frame per second, because it only draws a few numbers. A heavy overlay with a live graph, per-core CPU data, and a recording feature costs more, and on a phone that is already near its limit that cost can show up in the numbers. If you suspect the overlay itself is the problem, test the same scene with the overlay off and compare how the game feels. Measure with the overlay, then play without it is the habit that keeps the tool honest.
Why does my FPS drop after 20 minutes of play?
The most common cause is heat. As the battery and the chip warm up, the system lowers clock speeds to protect the hardware, and the frame rate falls with them. Check the temperature reading when the drop happens: if it climbed past the low 40s in Celsius at the same time, heat is the likely cause. Lower brightness, remove a thick case, take a short break, and lower one heavy graphics setting such as shadows or resolution scale, then test again.
Start tonight with one game, one overlay, and four numbers on screen. Play a scene you know, write the numbers down, change one setting, and play the same scene again. That single loop teaches you more about your phone than any list of recommended settings, because the numbers are yours, the phone is yours, and the game is the one you actually play. Your phone, your games, your numbers — learn them once, and every graphics choice after that gets easier.

