

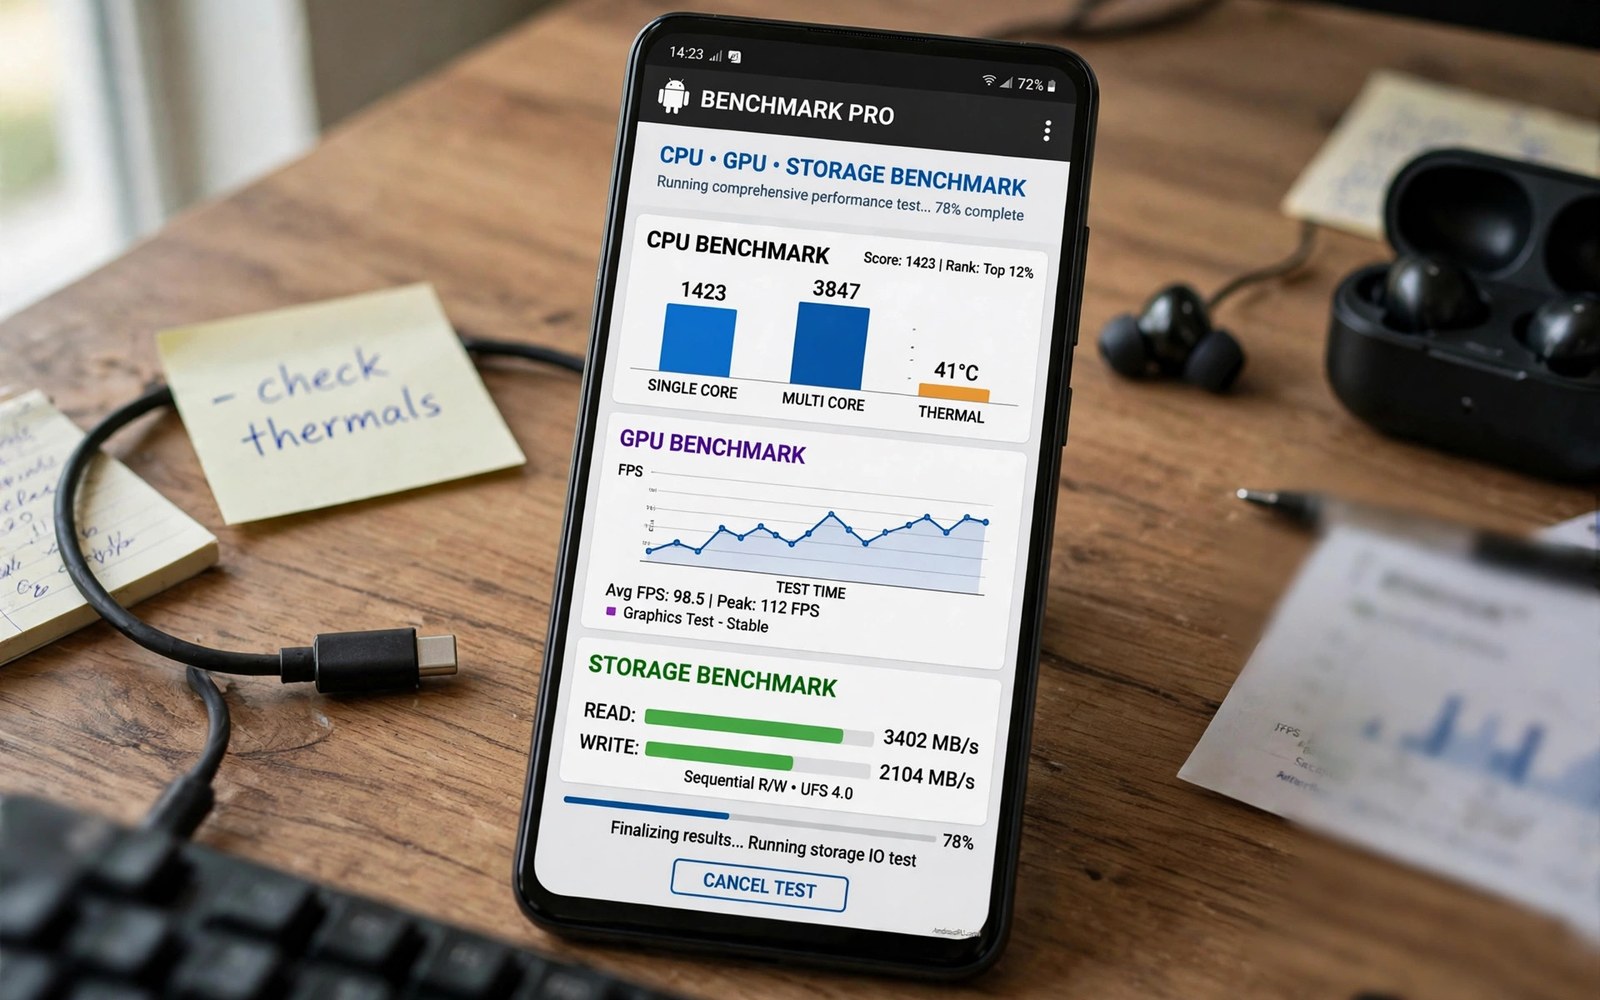
System benchmark apps turn phone speed into numbers you can compare. A CPU score and a GPU score and a storage speed tell you where a phone is strong and where it lags. This guide explains how these tests work and how to read their results without being fooled by a single big number. This article covers system benchmark apps in plain language for everyday Android users.
A benchmark is only useful when the test conditions stay the same. Heat and battery level and background apps all change scores. Run tests the same way every time and the numbers become a real tool. If you want to watch heat during a long test run then pair your benchmark with a thermal monitor so throttling never surprises you.
What CPU benchmarks actually measure
CPU tests run math and logic tasks that mimic real work. Single core tests measure one fast core. Multi core tests measure all cores working together. A phone with strong single core speed feels snappy in menus and messaging. A phone with strong multi core speed handles video editing and heavy multitasking better.
Scores depend on how long the test runs. Short bursts let a phone run at peak speed. Long tests heat the chip and force it to slow down. That slowdown is called throttling and it matters for gaming and long edits. A good benchmark app shows both burst scores and sustained scores so you see the full picture.
GPU tests and real game performance
GPU tests render 3D scenes and measure frame rates. Higher frame rates mean smoother games. But a test scene is not a real game. Real games add network code and physics and touch input. So treat a GPU score as a rough guide and not a promise of exact game frame rates.
Watch for resolution tricks in GPU tests. Some tests render at a lower resolution to inflate frame rates. Compare scores only when the test settings match. The same phone can score very differently at different resolutions. Always note the test name and settings next to any score you quote.
Storage speed tests that matter daily
Storage tests measure sequential read and write and random access. Sequential speed matters for copying large video files. Random access matters for opening apps and loading game levels. A phone with fast random access feels responsive even if its sequential numbers look modest.
Run storage tests with enough free space. A nearly full drive slows down because it has less room to manage writes. Keep at least fifteen percent free before you test. Run the test twice and take the second result since the first run warms caches and can skew numbers.
Thermal limits and why scores drop
Phones slow down on purpose when they get hot. This protects the battery and the chip. A benchmark that ignores heat will show a great first score and a poor third score. That drop is normal and it tells you how the phone behaves in real long sessions.
Cool the phone between runs for fair comparisons. Remove the case and let the phone rest for five minutes. Charge level also matters since low battery can limit peak speed. Test at similar battery levels and similar room temperatures for results you can trust.
How to compare scores across phones fairly
Compare the same benchmark app and the same version on both phones. Different apps use different tests and their scores never match. Note the phone model and the software version next to each score. An update can change scores by tuning power or scheduling.
Ignore tiny score gaps. A three percent gap is noise and not a real difference. Look for gaps above ten percent before you call one phone faster. Also weigh the score against price and battery life. The fastest phone is not the best phone if it dies by lunch.
Reading benchmark charts like a reviewer
Benchmark charts show scores across phones in one view. Look at the spread between top and bottom scores. A tight spread means the test barely separates phones. A wide spread means the test stresses a real difference. Ignore charts that hide test settings since settings change results more than hardware sometimes.
Check the chart date and software versions. Old charts reflect old tuning. A phone that scored low at launch may score higher after updates. Reputable charts list app version and test date next to every score. Charts without that metadata are decoration and not data.
Sustained performance versus peak scores
Peak scores capture a cool phone at full speed. Sustained scores capture a warm phone after minutes of load. Real gaming and editing live in the sustained zone. A phone with a high peak and a low sustained score feels fast for a minute and then stutters. A phone with a modest peak and a strong sustained score feels steady for hours.
Test sustained performance with a looping benchmark or a long stress test. Watch scores across loops. A gentle decline signals good cooling. A cliff drop signals aggressive throttling. Compare the tenth loop against the first loop. That gap predicts real long session behavior better than any single number.
Storage benchmarks and app install speed
Storage speed shapes install times and game loading times. A fast drive installs a large game in minutes. A slow drive stretches the same install far longer. Random read speed matters most for loading many small game files. Sequential speed matters most for copying one large video.
Test storage when the drive is partly full. Empty drive tests flatter slow storage. A drive at seventy percent full shows realistic daily speed. Note free space next to every storage score you record. That context keeps comparisons honest across phones with different usage levels.
Battery impact of benchmark apps
Benchmarks drain battery fast by design. A full suite can consume ten percent or more in one run. Charge before testing and avoid testing on low battery. Low battery triggers power saving that caps scores and corrupts comparisons.
Heat from benchmarking also affects later battery readings. Let the phone cool before you judge battery drain after a test. Separate benchmark days from battery test days when you want clean data for both. Clean method beats a rushed combined test every time.
Choosing a benchmark app you can trust
Trust benchmark apps with transparent methods and public test descriptions. A good app explains each subtest in plain words. It shows subscores and not just one total. Subscores reveal whether a phone wins on CPU or GPU or storage.
Avoid apps that bundle cleaners or boosters with benchmarks. Bundled extras signal a marketing tool and not a measurement tool. Prefer apps updated regularly for new chips. An app that never updates cannot measure new hardware fairly.
Interpreting single core versus multi core gaps
A large gap between single core and multi core scores reveals chip design priorities. Chips with a few very fast cores score high on single core tests. Chips with many efficient cores score relatively higher on multi core tests. Daily phone feel tracks single core speed closely since most interactions use one or two cores heavily. Heavy editing and exporting track multi core speed more closely.
Compare gaps across phones rather than judging one gap alone. A phone whose multi core score barely exceeds its single core score may throttle under all core load. A phone with a strong multi core multiple handles sustained heavy work better. Use the ratio as a clue about thermal design and scheduling and not as a verdict by itself. Pair ratio reading with a sustained test for a complete picture.
GPU benchmarks and display refresh interplay
High refresh displays demand more GPU work per second. A GPU score measured at sixty hertz does not predict performance at one hundred twenty hertz. The display doubles frame demand while the GPU stays the same. Benchmark apps that lock refresh rate give cleaner comparisons. Note the refresh setting next to every GPU score you record.
Adaptive refresh complicates testing further since the rate shifts mid test. Lock refresh to a fixed value during benchmark runs for consistency. Test both sixty and one hundred twenty hertz when you care about real gaming feel. The gap between those two results shows the true cost of smooth display on that phone.
Why storage scores vary between runs
Storage scores vary with free space and background writes and thermal state. A phone writing cloud backups during a test scores lower. A nearly full drive scores lower than an empty one. Background app updates during a test add noise too. Control these variables or accept wide score ranges.
Run storage tests after a fresh reboot with no pending updates. Close cloud sync apps temporarily for the test window. Keep free space consistent across compared phones. These controls shrink variance enough to make storage comparisons meaningful. Without controls storage scores mislead more than they inform.
Benchmark ethics and sponsored scores
Some benchmark charts come from vendors with an interest in the result. Sponsored charts may cherry pick favorable subtests or hide throttling behavior. Prefer independent charts that publish full methods and raw subscores. A chart that shows only one total score hides weaknesses by design.
Check whether a benchmark app itself carries vendor partnerships. Partnerships do not prove bias but they deserve disclosure. Independent reviewers who test retail phones beat launch event demos every time. Retail units with shipping software give the honest numbers buyers will actually experience.
adb shell cat /sys/class/thermal/thermal_zone0/tempThe command above follows the standard syntax for the Android developer bridge and reads a thermal zone value so you can check chip temperature before and after a benchmark run.
Common mistakes
The most common mistake is running a benchmark once and quoting that score forever. One run captures one moment with one temperature and one battery level. Run the test three times and report the middle score. That habit removes most of the noise from your results.
Another mistake is comparing scores from different benchmark apps. Each app uses its own scenes and its own math. A score from one app cannot be converted to another app. Pick one app and stick with it for every comparison you make.
People also benchmark with a hot phone straight from gaming. Heat throttles the chip and the score drops hard. Let the phone cool first. A full hardware report before testing also confirms the exact chip and RAM so your comparison rests on real specs and not on guesswork.
Frequently asked questions
Do benchmark scores predict gaming performance?
Partly. GPU and sustained CPU scores predict gaming better than burst scores. But real games add network and thermal factors. Use benchmarks to shortlist phones and real gameplay to make the final call.
Why does my score drop on the second run?
Heat is the usual cause. The chip slows down to protect itself. Let the phone cool and close background apps before you run the test again. A big drop across runs signals aggressive throttling.
Can benchmarks damage my phone?
No. Benchmarks stress the chip but phones are built to throttle before damage occurs. Avoid running back to back tests for an hour. Short test sessions with cooling breaks are completely safe.
Conclusion
Benchmark apps are useful when you control the conditions and read more than one number. Test CPU and GPU and storage and watch heat across runs. That method gives you a fair picture of any Android phone.
Your next step is concrete. Pick one benchmark app and run its full suite three times with cooling breaks. Record the middle scores. Then check real-time monitor overlays during a game to see whether benchmark speed shows up in real play.

