

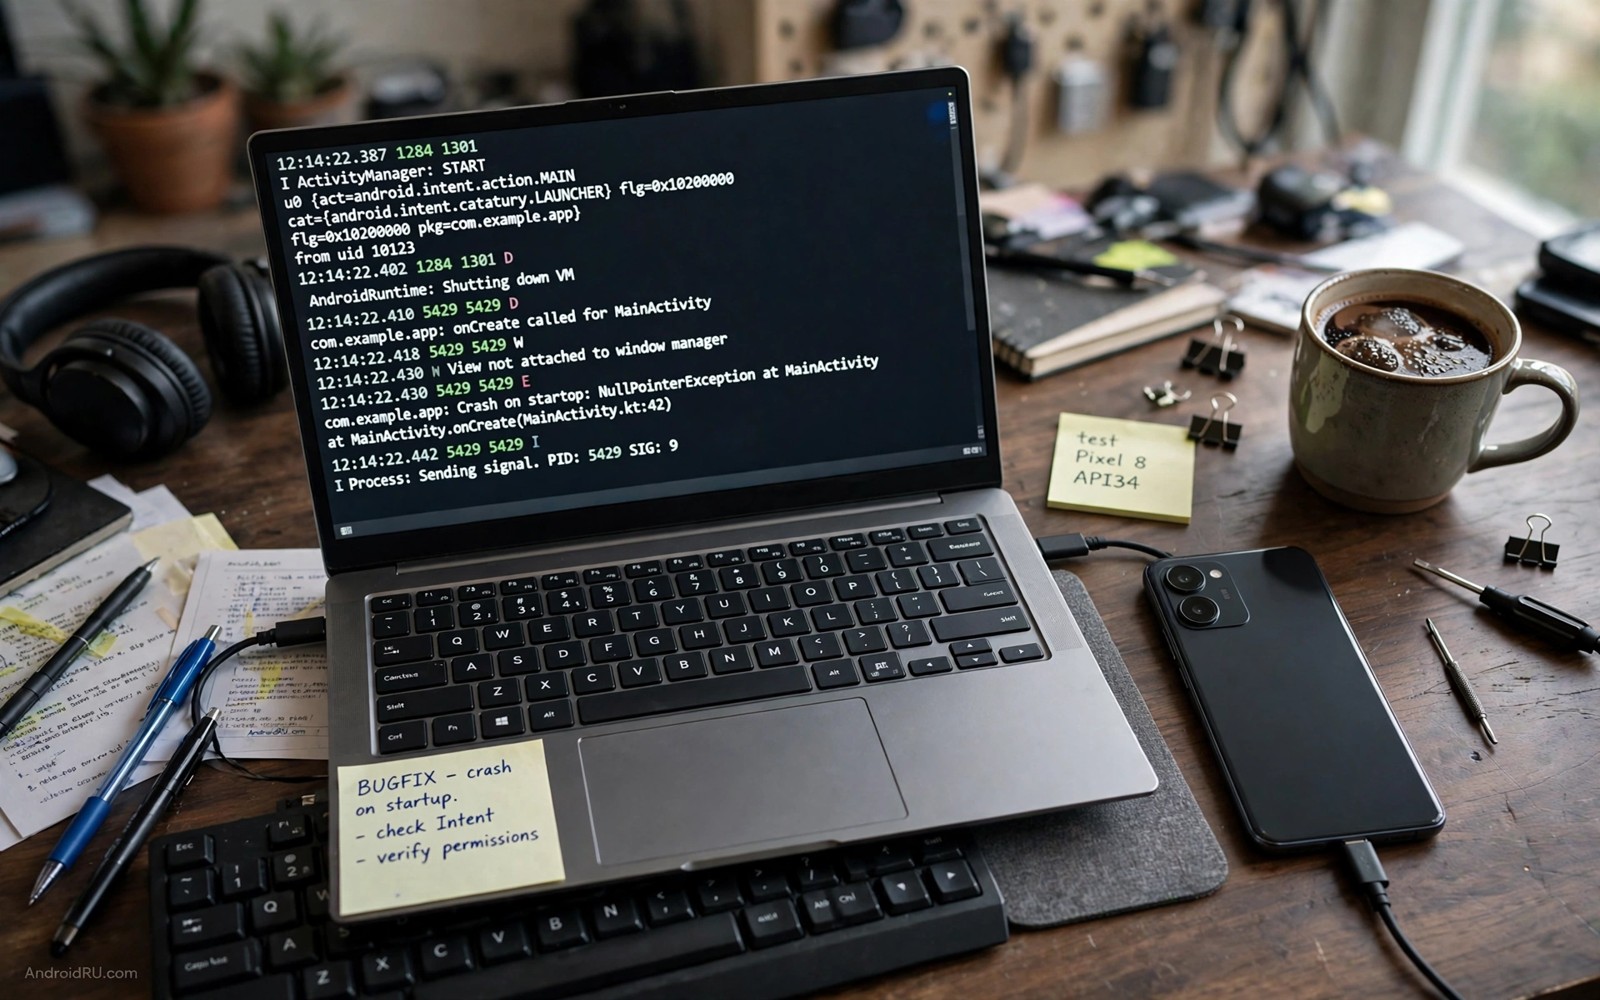
Logcat is the Android logging system that records messages from apps and system services. A busy device can produce thousands of log lines per minute. A developer who reads Logcat without filters will drown in noise. A developer who filters well can find a crash or a state change in seconds. Filtering is therefore a core debugging skill rather than a nice extra.
Logcat messages carry a tag and a priority and a process identifier and a timestamp. A tag identifies the part of code that logged the message. Priority ranges from verbose to error. Process identifier links a message to a specific app process. Those fields together make powerful filtering possible when you know how to combine them.
This guide explains advanced Logcat filtering tricks for your own apps on devices that you own. It covers command line filters and studio filters and saved configurations. It also covers privacy rules for logs. Logs can contain personal data and tokens. Handle log files with the same care that you give to user data.
Reading a Logcat line correctly
A Logcat line starts with a timestamp and a process identifier and a thread identifier. It then shows a priority letter and a tag and the message text. The priority letter tells you whether the message is verbose or debug or info or warning or error. An error message deserves attention first during a crash investigation. A verbose message is useful only when you need deep detail for a specific subsystem.
Tags are the key to filtering. A good codebase uses consistent tags for each feature area. A network tag for network code and a database tag for database code make filtering easy. An inconsistent tag habit makes filtering hard because related messages scatter across many tags. Adopt a tag convention in your own app and enforce it in code review.
Process identifiers change each time an app restarts. A filter based on a process identifier from an old run will miss messages from a new run. Filter by package name when the tool supports it. Package based filtering follows the app across restarts. That behaviour saves time during a debugging session with many app restarts.
Command line filters that save time
The basic command line filter uses a tag and a priority together. A filter such as Network:D shows debug and higher messages for the Network tag. A filter such as *:S silences all tags except those that you list explicitly. Combining silence with a few explicit tags gives a clean log stream that shows only the areas that you care about.
Regular expressions add power to command line filtering. A pattern can match several related tags at once. A pattern can exclude messages that contain a noisy word. Use patterns carefully because a broad pattern can hide the message that you need. Test a pattern on a short log capture before you use it for a long session.
Time based filtering helps when a bug happens at a known moment. Note the time when you reproduce the bug. Then filter the log to a window around that time. A time window removes hours of unrelated messages from before the reproduction. That simple habit often finds a bug faster than a complex tag pattern.
Android Studio filters and saved setups
Android Studio provides a Logcat window with package filtering and tag filtering and text search. Package filtering shows only messages from the app that you selected. That filter alone removes most system noise. Add a tag filter for the feature area that you investigate. The combination gives a focused stream that is easy to read during a live test.
Saved filter configurations help teams share debugging setups. A configuration for network debugging can include network and API tags at debug priority. A configuration for crash debugging can include error priority for all tags plus the app package. Save those configurations in the project documentation so a new team member can start debugging without rediscovering the filters.
Colour and formatting settings also help reading. Error messages in a distinct colour stand out in a long stream. A compact format that hides thread identifiers can improve readability for simple cases. A detailed format that shows thread identifiers helps when a bug involves several threads. Choose the format that fits the investigation at hand.
Filtering for crashes and performance issues
A crash investigation starts with the stack trace. Filter for error priority and for the app package around the crash time. The stack trace shows the method chain that led to the crash. Read the first app method in the trace rather than only the system methods at the top. The first app method usually points to the code that needs a fix.
A performance investigation needs a different filter. Filter for messages from the feature area that feels slow. Look for repeated work such as the same query running many times. Look for long gaps between messages that should be close together. A gap in the log often points to a blocking operation that does not log its own duration.
An ANR investigation uses a similar method with a focus on main thread messages. Filter for the app package and look for messages just before the ANR time. A message that repeats or a message that stops abruptly can point to the blocking code. Combine Logcat evidence with a trace file for a full picture of main thread behaviour.
- Filter for error priority around the crash time.
- Read the first app method in the stack trace.
- Look for repeated work in performance logs.
- Combine Logcat with a trace file for ANR cases.
Code you can adapt
# Logcat filters for a focused debugging session
# Show only your app package at debug level and above
adb logcat --pid=$(adb shell pidof -s com.example.myapp)
# Show a specific tag at debug level and silence other tags
adb logcat Network:D *:S
# Save a filtered capture to a file for later review
adb logcat -d > logcat-capture.txt
The snippet above is an original example written for this guide. It shows command line filters that focus Logcat on one app and one tag for a test session.
The package filter in the example uses the process identifier for the current run. That identifier changes after an app restart. Re-run the pid command after a restart to get the new identifier. Some tools offer package based filtering that handles restarts automatically and that option is easier for long sessions.
Saving a filtered capture to a file helps team debugging. A colleague can read the same log that you saw without reproducing the bug. Remove personal data and tokens from a log file before sharing it. A log file that contains a token should be treated as sensitive and shared only through a secure channel.
How this topic connects to nearby work
Callback logs are a major Logcat source and the hook side is explained in the guide to ART runtime hooks.
Automated tests generate the logs that filtering makes readable as shown in the guide to automate mobile app UI tests.
Log heavy builds also benefit from the speed work described in the guide to optimize Gradle build speeds.
Putting it into practice
Log buffer sizes affect how much history Logcat keeps. A small buffer may overwrite the crash log before a developer can read it. A large buffer keeps more history but uses more memory. Check the buffer size setting on a test device when a crash log disappears quickly. Increase the buffer for a debugging session on a test device and restore the default afterwards. That setting is a test device choice rather than a production change.
Remote log collection needs explicit user consent and careful redaction. An app that uploads logs automatically can send personal data to a server without the user realising it. Ask for consent before uploading logs and redact tokens and personal identifiers from the upload. Offer a way for the user to view the log before sending it. Transparent log collection builds trust while silent collection destroys it.
A final Logcat check should test filters during a real bug reproduction rather than only on a calm log stream. A calm stream makes any filter look good. A busy stream during a reproduction shows whether the filter still isolates the relevant lines. Reproduce a known bug and apply your saved filters during the reproduction. Note any noise that still gets through and refine the filter. That live test proves the filter under realistic conditions.
Common mistakes
A common mistake is to read Logcat without any filter on a busy device. Unfiltered logs scroll too fast to read and the important message disappears. Start every session with a package filter. Add a tag filter as soon as you know which feature area you investigate.
Another mistake is to log sensitive data in production builds. Tokens and passwords and personal messages should never appear in logs. Remove sensitive logging before release or guard it behind a debug flag. A log leak in production can expose user data to anyone who can read device logs.
A third mistake is to share a full unfiltered log file publicly. A full log can contain device identifiers and account details and nearby app activity. Filter the log to the relevant lines and redact personal data before sharing. A focused redacted log helps helpers without exposing user privacy.
Frequently asked questions
Why do I see no logs for my app in Logcat?
Check that the correct device is selected and that the app is running. Check that the package filter matches the app package name. Check that the log level is not set to silence for your tags. A wrong device or a wrong package is the most common cause.
Should I use verbose logging in production?
No for most apps. Verbose logs slow the device and they can leak details. Use verbose logging in debug builds for deep investigation. Use info and warning and error levels in production for important events only.
How do I find a crash that happened an hour ago?
Use a saved log file if the device captured one. Otherwise reproduce the crash and capture logs around the reproduction time. A time window filter helps isolate the crash from unrelated messages that came before it.
Conclusion
Advanced Logcat filtering turns a flood of messages into a focused debugging stream. Package filters and tag filters and priority filters together remove most noise. Time windows and saved configurations make the process repeatable for a team. Privacy care for log files protects users while still helping developers find bugs fast.
Your concrete next step is to create two saved Logcat filters today for your own app. Create one filter for crash debugging at error priority and one filter for network debugging at debug priority. Use those filters in your next debugging session and note how much faster you find the relevant lines.

