

Best System Benchmark Apps: Testing CPU, GPU, and Storage Speeds
I bought a new phone last year because the spec sheet promised a huge jump in speed, and for the first week it felt fast. Then a long gaming session turned sluggish, apps took longer to open, and I started to wonder whether the phone was faulty or the marketing had simply oversold it. A benchmark app gave me the answer in about ten minutes: the processor was fine in short bursts, but it slowed down hard once it got hot, and the storage was slower than the model it replaced. Numbers will not fix a phone, yet they turn vague frustration into a clear diagnosis.
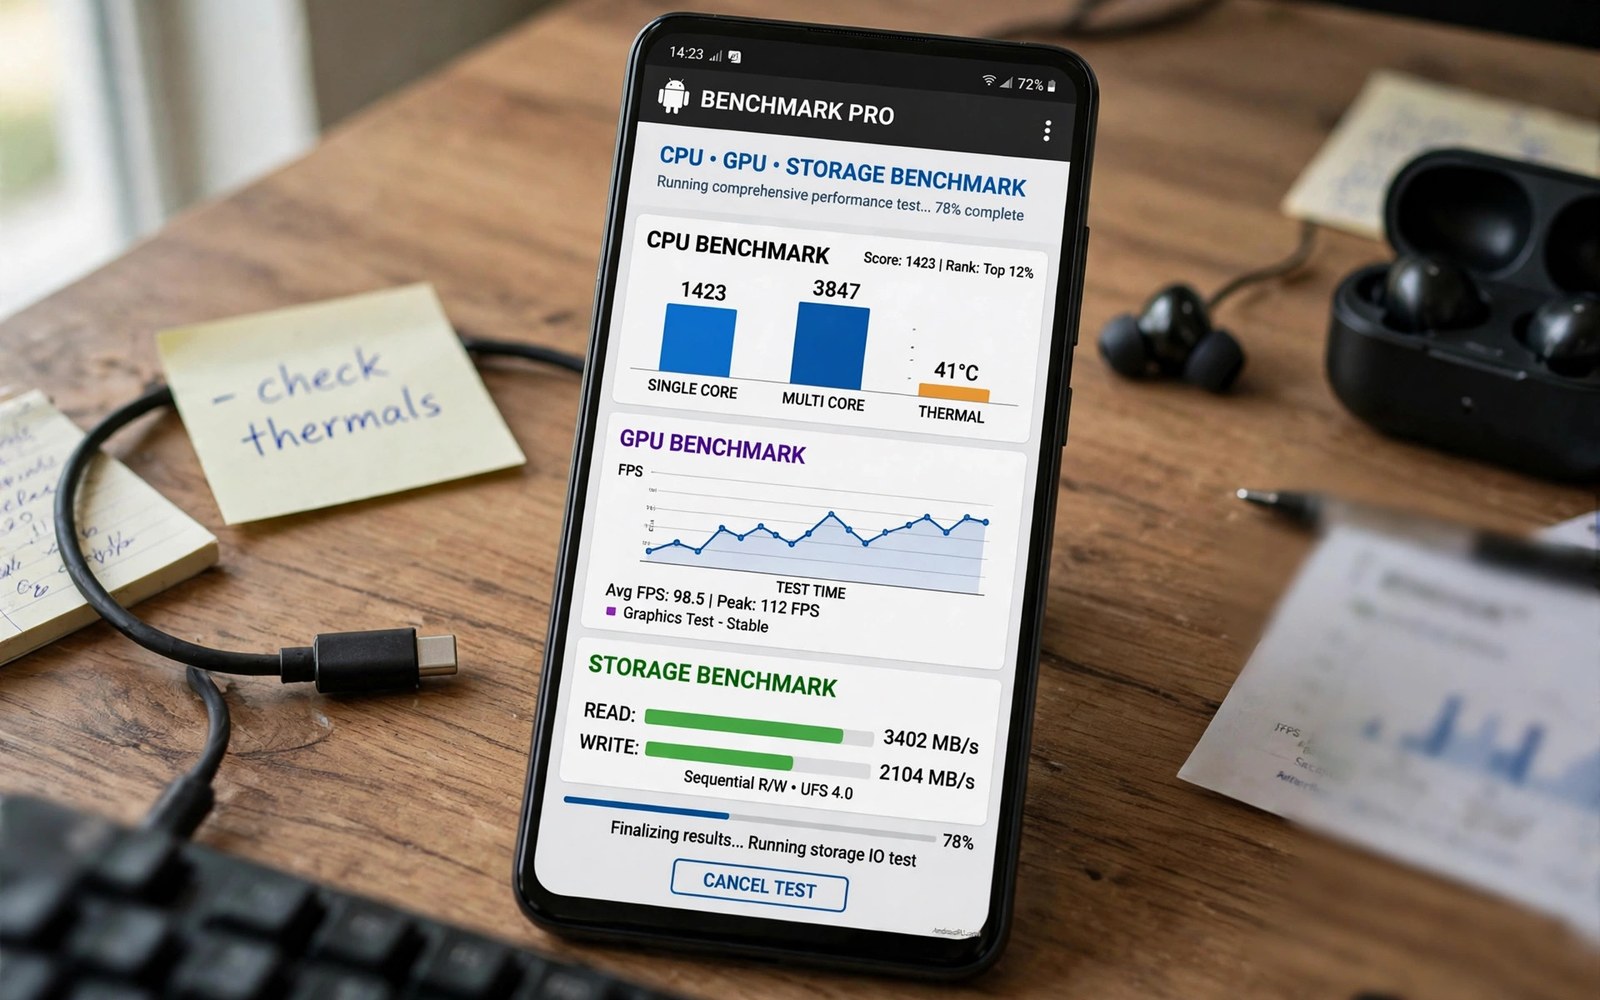
That is the real job of a system benchmark app. It runs the same controlled workload on any phone and reports a score you can compare, repeat, and track over time. CPU tests measure raw calculation speed, GPU tests measure 3D rendering, and storage tests measure how fast files move in and out of flash memory. Used well, these tools help you check a new phone before the return window closes, spot a battery or heat problem early, and settle the argument about which chip is actually faster in daily use.
This guide covers the benchmark apps I trust most on Android, how each one works, and how to read the results without being fooled. You will find eight named apps with honest pros and cons, a side-by-side comparison table, a repeatable testing routine, and answers to the questions readers ask most. Every score below is explained in context, because a single number on its own tells you almost nothing.
What CPU, GPU, and Storage Benchmarks Actually Measure
A CPU benchmark runs math, logic, and data-handling tasks that stand in for real work: opening apps, compressing a photo, rendering a web page, or crunching a spreadsheet. Single-core tests push one fast core to its limit, which tracks how snappy menus and messaging feel. Multi-core tests spread work across every core, which tracks heavy jobs such as video editing, compiling code, or running several demanding apps at once. A phone can lead on one and trail on the other, so check both numbers before you draw a conclusion.
GPU benchmarks render 3D scenes and count frames per second, and the best ones use modern graphics APIs such as Vulkan to mirror what current games actually demand. Storage benchmarks split into sequential speed, which governs copying a large video file, and random speed, which governs opening apps and loading game levels. Random read speed is the number most people feel every day, even though sequential speed is the one printed on the box. A balanced phone needs decent results in all three areas, not a record score in just one.
Scores also depend on the test itself. A short burst lets a chip run at peak clock speed, while a twenty-minute stress test exposes throttling, the point where heat forces the chip to slow down to protect itself. That is why serious testers report both burst scores and sustained scores, and why you should never compare a score from one app with a score from another. Each app uses its own workload, its own scoring scale, and its own test length, so only same-app, same-settings comparisons are valid.
How to Run a Fair Benchmark Test on Android
A benchmark is only as honest as the conditions around it. Heat, battery level, background apps, and even a recent system update can move a score by ten percent or more, which is enough to flip a close comparison. The routine below takes five minutes and removes most of that noise, so the numbers you record actually mean something when you compare them next month or against a friend’s phone.
Prepare your phone before you press start
Charge the phone to at least 50 percent, because many phones cap performance below 20 percent to save power. Let the phone cool to room temperature, close every app you are not testing, and turn off adaptive battery or performance modes that change clock speeds mid-test. Run each test twice and keep the second result, since the first run often includes warm-up effects from a cold cache.
Check battery and temperature first
A warm phone throttles sooner, and a low battery can trigger power saving without any visible warning. If the back of the phone already feels warm, wait ten minutes before testing. If you want to watch heat during a long test run, pair your benchmark with a thermal monitor so you can see exactly when throttling starts instead of guessing from a falling score.
Close background apps and turn off adaptive features
Sync, backups, and app updates running in the background steal CPU cycles and storage bandwidth during a test. Put the phone in airplane mode with Wi-Fi on only if the test needs it, pause cloud sync, and disable any game booster that changes resolution or frame-rate caps. Write down the test name, the app version, and the phone’s software version next to every score, because an update can shift results and you will want to know why.
Best System Benchmark Apps for CPU, GPU, and Storage Speeds
The eight apps below cover every angle: pure CPU speed, real 3D graphics, full-system workloads, and deep storage testing. I have used each of them on more than one phone, and the notes below reflect what actually happens in practice, including the quirks that the app descriptions never mention. Pick one CPU app, one GPU app, and one storage app to start, then add the rest only if you want the full picture.
1. Geekbench 6
Geekbench 6 is the most widely quoted CPU benchmark on Android, and for good reason: it runs real-world workloads such as image processing, machine learning inference, and file compression, then reports separate single-core and multi-core scores. The test suite is short, usually finishing in a few minutes, and results upload to an online browser where you can compare your phone with hundreds of other models. Geekbench 6 also includes a GPU Compute test that measures OpenCL and Vulkan performance, so one app covers both the processor and the graphics pipeline at a basic level.
Pros:
- Short, repeatable tests that finish in minutes
- Single-core and multi-core scores are easy to compare across phones
- A large online result database makes cross-device comparison simple
- GPU Compute test covers Vulkan and OpenCL in the same app
Cons:
- The free version shows ads and limits some result details
- It measures burst speed, not sustained performance under heat
- It does not test storage speed at all
Verdict: Best for anyone who wants one trusted CPU number to compare phones. Start here if you only install one benchmark app.
2. AnTuTu Benchmark
AnTuTu is the all-in-one option: it runs CPU, GPU, memory, and user-experience tests in a single session and rolls them into one overall score, while still showing the sub-scores for each area. The 3D scenes are demanding, the storage test covers sequential and random access, and the app includes a stress test that reveals how a phone holds up over fifteen minutes of load. Its overall score is the number most often quoted in phone reviews, which makes it handy when you want to check a reviewer’s claim against your own device.
Pros:
- One run covers CPU, GPU, memory, and storage together
- Sub-scores let you see which part of the phone is weakest
- Built-in stress test exposes throttling clearly
- Huge result database, including many phones not sold in your region
Cons:
- The combined score hides detail if you only read the headline number
- Test scenes and scoring change between major versions, so old scores do not compare
- The app is large and the full test takes several minutes
Verdict: Best for a full-system health check in one sitting. Use it when you want the whole picture, not just one component.
3. 3DMark
3DMark is the benchmark I reach for when graphics performance is the question. Its Wild Life and Solar Bay tests render demanding 3D scenes using Vulkan and ray tracing, and the stress test loops the scene twenty times to measure stability and frame-rate consistency. The result is not just an average frame rate but a stability percentage, which tells you whether a phone holds its speed or fades after a few minutes. That stability figure matters more for gaming than any peak score, because a phone that drops frames after ten minutes feels worse than a slightly slower phone that never drops at all.
Pros:
- The most demanding mobile GPU tests available, including ray tracing in Solar Bay
- Stress test reports a stability percentage, not just a peak score
- Results are comparable across Android, iOS, and Windows devices
- Clean interface with clear charts for frame rate over time
Cons:
- It tests graphics only, so you still need a separate CPU and storage app
- The heaviest tests need a fairly recent phone to run at all
- Some tests are paid content inside the app
Verdict: Best for gamers and anyone comparing phones for 3D performance. If frame rates matter to you, this is the reference test.
4. PCMark for Android
PCMark takes a different approach: instead of synthetic math, it runs everyday tasks such as browsing, editing documents, manipulating photos, and playing video, then scores how smoothly the phone handles them. The Work 3.0 benchmark mirrors office-style use, while the Storage 2.0 test measures real file operations. PCMark also includes battery life tests that drain the phone under a controlled workload, which makes it the best choice when your question is about all-day use rather than peak speed.
Pros:
- Tests mirror real daily tasks instead of abstract math
- Battery life benchmark shows screen-on time under a fixed workload
- Storage test measures practical file operations, not just raw throughput
- Results are stable and repeatable across runs
Cons:
- It will not show the peak CPU or GPU numbers that enthusiasts quote
- The full battery test takes hours, so plan it overnight
- Fewer phones in the comparison database than Geekbench or AnTuTu
Verdict: Best for buyers who care about everyday smoothness and battery life more than record scores.
5. GFXBench
GFXBench is a long-running graphics benchmark focused on OpenGL and Vulkan rendering, with well-known scenes such as Aztec Ruins, Car Chase, and Manhattan. It reports frame rates at fixed resolutions, which makes comparisons fair across phones with different screen resolutions, and it includes long-term performance tests that track how frame rates hold up over thirty minutes. Developers and reviewers have used it for years, so there is a deep history of results for older phones too.
Pros:
- Fixed-resolution rendering keeps comparisons fair across devices
- Long-term tests show sustained graphics performance clearly
- Supports both OpenGL ES and Vulkan test paths
- Large archive of results for older phones and chips
Cons:
- The interface feels dated next to newer benchmark apps
- It covers graphics only, with no CPU or storage tests
- Some of the older scenes no longer reflect modern games
Verdict: Best for tracking GPU performance over time and comparing phones with different screen resolutions.
6. A1 SD Bench
A1 SD Bench is a focused storage tester that measures read and write speeds for internal memory and SD cards, with both sequential and random access tests. It is simple to use: pick the target, press start, and watch the numbers appear, including IOPS figures that explain why one phone opens apps faster than another. The app also benchmarks RAM speed and includes a database of results for specific phone models and memory cards, which helps when you are choosing a microSD card for a phone that still has a slot.
Pros:
- Clear sequential and random read/write results, including IOPS
- Tests internal storage, SD cards, and RAM in one app
- Lightweight and fast, with results in under a minute
- Model database helps when shopping for a microSD card
Cons:
- It tests storage only, so pair it with a CPU and GPU app
- The interface is plain and the result charts are basic
- Free version includes ads between tests
Verdict: Best for diagnosing slow app loading and for picking a fast microSD card.
7. CPDT (Cross-Platform Disk Test)
CPDT is a small, no-nonsense disk benchmark that runs sequential and random read/write tests with configurable file sizes and queue depths, then shows the results as simple charts. Because it is cross-platform, you can run the same test on a phone, a tablet, and a laptop and compare the numbers directly. It is a favorite among testers who want raw storage data without a flashy interface or an account, and it is light enough to keep installed permanently.
Pros:
- Configurable test sizes and queue depths for deeper analysis
- Same test runs on phones, tablets, and computers for fair comparison
- No account needed and very small install size
- Clear charts that are easy to screenshot and share
Cons:
- The plain interface can confuse first-time users
- No CPU or GPU testing, so it is a single-purpose tool
- Fewer built-in comparison results than the big-name apps
Verdict: Best for testers who want raw, configurable storage numbers without extra features.
8. AndroBench
AndroBench is the classic Android storage benchmark, measuring sequential read/write, random read/write, and SQLite database performance, which reflects how apps store and fetch small pieces of data. SQLite speed is the hidden number behind contact loading, message search, and app startup, so a phone with strong random performance and weak SQLite scores can still feel slow in daily use. AndroBench has been around for years, which makes it useful for comparing a new phone against results recorded long ago.
Pros:
- Includes a SQLite test that reflects real app database speed
- Simple one-tap test with results in about a minute
- Long history makes old results still useful for comparison
- Free with no account required
Cons:
- It has not been updated as often as newer storage apps
- Storage only, so it covers one part of the system
- The interface looks dated and the charts are minimal
Verdict: Best for a quick, classic storage check, especially the SQLite result that other apps skip.
System Benchmark App Comparison Table
The table below puts the eight apps side by side so you can pick the right combination at a glance. No single app covers everything well, which is why most serious testers keep two or three installed.
| App | Best for | CPU | GPU | Storage | Free version |
|---|---|---|---|---|---|
| Geekbench 6 | CPU comparison | Yes | Basic compute | No | Yes, with ads |
| AnTuTu Benchmark | Full-system score | Yes | Yes | Yes | Yes |
| 3DMark | Gaming graphics | No | Yes | No | Yes, some paid tests |
| PCMark for Android | Daily use and battery | Yes | Basic | Yes | Yes |
| GFXBench | Graphics over time | No | Yes | No | Yes |
| A1 SD Bench | Storage and SD cards | No | No | Yes | Yes, with ads |
| CPDT | Raw storage data | No | No | Yes | Yes |
| AndroBench | Storage and SQLite | No | No | Yes | Yes |
A practical starter set is Geekbench 6 for the processor, 3DMark for graphics, and A1 SD Bench for storage. That trio costs nothing, covers all three areas, and produces numbers you can compare with published reviews. Add AnTuTu when you want one overall score, and PCMark when battery life is part of the question.
Reading Your Scores Without Getting Fooled
A benchmark score is a measurement, not a verdict, and the most common mistake is treating it as one. Two phones can sit within five percent of each other and feel identical in daily use, while a twenty percent gap in storage random read speed is something you will notice every time you open an app. Pay attention to the sub-scores: a phone with a strong CPU and weak storage will still stutter when loading large games, and a phone with a strong GPU and poor sustained performance will still drop frames in a long session.
Context matters as much as the number. Check the test version, because a Geekbench 5 score and a Geekbench 6 score use different scales and cannot be compared. Check the phone’s software version too, since a system update can change thermal limits and move scores by a visible margin. When you want the full context behind a number, a full hardware report shows the exact chip, memory type, and storage model, which explains why two phones with the same chip can still score differently.
Watch out for benchmark cheating, a real problem in the past where some phones detected a test app and boosted clock speeds beyond normal limits. Reputable benchmark makers now watch for this behavior, and the best defense on your side is to pair a benchmark with observation: if a phone scores brilliantly in a two-minute test but feels slow in a twenty-minute game, trust the game. Sustained performance tells the truth about a phone, while a peak score only tells you what it can do for a minute.
What to Do When Scores Drop or Look Wrong
A falling score is a clue, not a disaster, and the cause is usually simple. Heat is the most common culprit, followed by a battery saver kicking in, a system update changing thermal rules, or a background backup running during the test. Work through the checks below before you conclude that the hardware is failing.
Scores dropped after a system update
Manufacturers sometimes lower sustained clock speeds in an update to fix overheating or improve battery life, and that shows up as a lower multi-core or stress-test score while single-core numbers stay the same. Re-run the test twice on a cool phone, compare with results from the same app version, and search for other owners of your model reporting the same change. If the drop is real and large, the fix is usually to wait for the next update or to report it, not to factory reset the phone.
One score looks far lower than the rest
A single weak sub-score points at one component: slow random writes mean the storage is nearly full or aging, a weak GPU score with a strong CPU score points at a driver or resolution setting, and a weak memory score can follow a recent app install that runs in the background. Free up at least ten percent of storage, restart the phone, and re-run only that test. For live numbers while a game or test runs, real-time monitor overlays show frame rate, clock speed, and temperature on screen, which makes the weak link visible while it happens.
Benchmark Apps FAQ: CPU, GPU, and Storage Questions Answered
Which benchmark app is the most accurate for Android phones?
No single app is the most accurate for everything, because each one measures a different workload. Geekbench 6 is the reference for CPU speed, 3DMark is the reference for sustained graphics, and A1 SD Bench or AndroBench are the references for storage. Accuracy comes from the routine, not the app: same phone temperature, same battery level, same app version, and at least two runs. Compare only scores from the same app and the same version.
Why do my benchmark scores change every time I run the test?
Scores move because conditions move. A phone that just finished charging is warmer than a phone that sat idle, a background sync can steal CPU time, and the chip boosts higher on a cold start than on a third run in a row. Small changes of two to five percent are normal noise. A change larger than ten percent usually means heat, low battery, or a background task, so cool the phone, close apps, and run the test again.
Can benchmark apps damage my phone or wear out the storage?
Normal benchmark runs are safe: the tests are short, the phone’s own thermal limits protect the chip, and the amount of data written during a storage test is tiny compared with daily use such as recording video. Stress tests that loop for thirty minutes will make the phone hot, so give it a cool-down break between runs and do not run them back to back for an hour. If the phone ever feels too hot to hold, stop the test and let it cool.
Do benchmark scores predict real gaming performance?
They predict it roughly, not exactly. A high 3DMark or GFXBench score usually means smoother games, but real games add network code, physics, touch input, and different resolution settings, so the frame rate in your favorite game can still differ from the test. The stability percentage from a stress test is the most useful gaming signal: a phone that holds 90 percent stability will feel smoother in a long session than a phone with a higher peak score and 60 percent stability.
Final Verdict: Which Benchmark App Should You Start With?
If you install only one app, make it Geekbench 6 for a trusted CPU number you can compare anywhere. If you play games, add 3DMark and watch the stability percentage, not just the headline score. If apps feel slow to open, add A1 SD Bench and check random read speed and SQLite performance. That combination answers almost every question a phone buyer or owner has, and it costs nothing.
Run your tests today while the routine is fresh: charge past 50 percent, let the phone cool, close background apps, and record one CPU, one GPU, and one storage result with the app version noted. Save those numbers somewhere you can find them, then repeat the same tests in a month. The trend over time is worth more than any single score, because it shows whether your phone is holding up, whether an update helped or hurt, and whether the next phone you buy is actually an upgrade. Test once, write it down, and compare fairly — that habit turns benchmark apps from a curiosity into a genuinely useful tool.

