

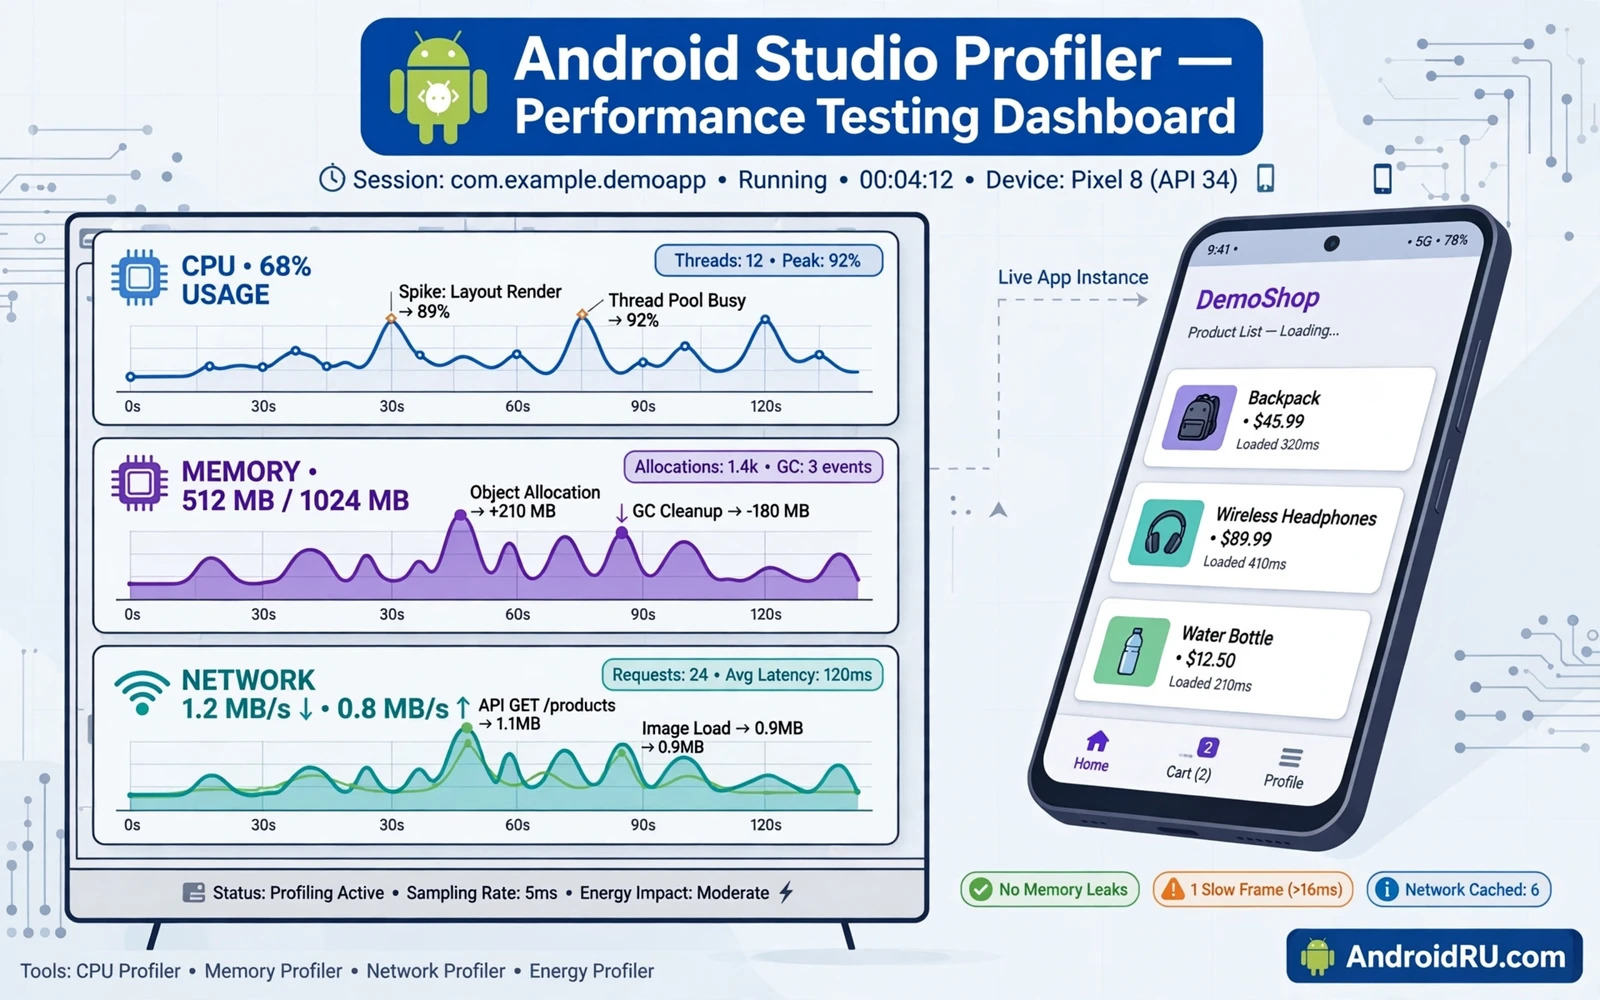
Performance testing separates a smooth app from a frustrating app. Users notice slow startup and stuttering scrolls and frozen screens. A profiler turns those vague complaints into measurable evidence. Android Studio ships profiler tools for CPU use and memory use and network use and energy use. This guide shows how to use those tools in a practical workflow. You will learn how to record a session and read the timeline and find the real bottleneck. You will also learn how to avoid common measurement mistakes. The goal is a faster app and a clearer decision about what to fix first.
Start with a question before you open any tool. Ask whether startup feels slow or scrolling feels rough or the app drains the battery in the background. Each symptom points to a different profiler and a different recording method. Startup trouble calls for a CPU recording during launch. A growing memory graph calls for a memory recording during long use. Network trouble calls for a network recording while the app talks to a server. A clear question keeps the session short and the result easy to read. Without a question you may collect a large trace and still miss the cause.
Run tests on a real device whenever you can. An emulator is useful for early checks but it hides real device behaviour. Thermal limits and storage speed and radio behaviour differ on real hardware. Close other apps before you record so background work does not pollute the result. Use a release build or a debuggable build that matches the build your users run. A debug build with extra checks can run slower than a release build. Note the device model and the system version and the build type with every recording so later comparisons stay fair.
val trace = Debug.startMethodTracing("launch")
// run the slow flow here
Debug.stopMethodTracing()
Why profiling beats guessing
Guessing leads to fixes that change code without changing the user experience. A developer may rewrite a screen that was never slow while the real problem sits in a background task. A profiler shows where time is actually spent. It shows which method runs most often and which thread blocks the interface. It also shows when work happens on the wrong thread. That evidence lets a small team spend effort where it matters most.
Profiling also protects battery life and memory health. Heavy work on the main thread can freeze the interface and trigger system warnings. Repeated allocations can force frequent garbage collection and cause visible stutter. Network calls that repeat without need can waste data and drain power. The profiler timeline makes those patterns visible as spikes and repeated blocks. Once you see the pattern you can redesign the work instead of patching the symptom.
A good habit is to profile before a change and after a change. Record a baseline for the slow flow and save the trace with a clear name. Apply one fix at a time and record again under the same steps. Compare the two timelines and check whether the hot method shrank or moved. If the result did not improve then the fix missed the cause. This discipline prevents a long list of hopeful changes that never reach the user as a real improvement.
The main profiler tools
The CPU profiler records method calls and thread activity during a chosen window. Method tracing shows the full call stack for a short period. Sampling records the stack at intervals and suits longer sessions with lower overhead. The flame chart shows the stack as layered blocks where wider blocks mean more time. The top down view groups time by caller. The bottom up view groups time by the method that actually ran longest. Use the call chart when you need the exact order of events on each thread.
The memory profiler tracks allocations and heap size and garbage collection events over time. It can capture a heap dump that lists live objects and their retaining paths. It can record allocations so you can see which code path creates many short lived objects. Watch for a heap that grows steadily during repeated use of one screen. That shape often points to a leaked reference or a cache without a size limit. Pair this view with the piece on memory leak patterns and fixes when a leak looks likely.
The network profiler shows requests and responses and payload timing for the app under test. It helps you spot repeated calls and slow endpoints and large payloads that block a screen. The energy profiler estimates power use from CPU activity and network activity and location use. Use it to check background work that should stay quiet when the screen is off. Together these tools give a full picture of performance instead of a single number that hides the cause.
A practical profiling workflow
Open the app on the device and navigate to the screen just before the slow flow. Start the profiler session and keep your steps simple and repeatable. Perform the slow action once and then stop the recording. A short recording is easier to read than a long recording full of unrelated taps. Repeat the same steps a second time to check whether the pattern is stable. If the two recordings differ sharply then background work or a cold cache may be shaping the result.
Read the main thread first because it owns the interface. Look for long blocks on that thread and expand them to see the methods inside. Check whether heavy work such as file parsing or image decoding runs there. Move that work to a background thread when the interface does not need the result at once. Check for layout passes that repeat during scrolling. A list that remeasures every item on every scroll frame will feel rough even when each item looks simple.
Read the timeline for thread interaction next. A main thread that waits on a lock or a network call will show a gap or a waiting block. Find the thread that holds the lock or owns the slow call. Fix the wait by removing the shared lock or by caching the result or by moving the call off the interface thread. Readers who debug without a cable can extend this workflow with the piece on wireless debugging over Wi-Fi and keep the same recording steps.
Check memory and network behaviour in the same session when the symptom involves them. A screen that loads images without bounds can allocate far more than the display needs. A feed that refetches the full list on every return can waste bandwidth and time. Fix image size to the display size and cache results with a clear expiry rule. Small changes in these areas often produce a larger perceived speedup than a deep rewrite of business logic.
Common measurement mistakes
Testing only on a fast flagship hides problems that budget devices reveal. Test on a mid range device and on a device with limited memory when your audience uses them. Testing only with a warm cache also hides startup cost. Kill the app and clear the state for a cold start test and then test a warm start separately. Report both results because users experience both paths during daily use.
Recording too much at once is another common mistake. A ten minute trace with random taps mixes many flows and buries the slow one. Record one flow at a time and name each trace after the flow and the device. Avoid changing two things between recordings. If you change code and change test data in the same run then you cannot tell which change helped. Keep the test data fixed while you compare builds.
Interpreting a single spike as a verdict is also risky. A spike may come from a system task or a first time cache fill or a thermal event. Repeat the recording and look for a stable pattern across runs. Check the system timeline for competing work during the spike. A pattern that repeats across devices and across runs deserves a fix. A single spike deserves a repeat test before any code change.
Fixing what the profiler reveals
Start with the largest block on the main thread and work downward. Replace repeated parsing with a cached model when the input has not changed. Replace a large image decode with a scaled decode that matches the view size. Batch small database writes into one transaction when the data allows it. Defer work that the user cannot see yet until the screen is visible. Each fix should target a block that the profiler actually showed.
Watch for work that repeats on every frame. Layout inflation inside a scrolling list is a classic case. Reuse view holders and avoid creating new objects inside the bind step. Avoid string building and date formatting inside a draw path when a cached value would serve. These small per frame costs add up fast because they run dozens of times per second. The profiler call chart makes repeated work obvious as a repeating stripe pattern.
Screen state changes can also hurt performance when they reload data without need. A rotation that refetches a full list wastes time and network use. A state holder that survives rotation can keep the loaded data and restore the scroll position. Readers who face that exact problem can continue with the piece on handling orientation changes without a reload and apply its state saving pattern after profiling confirms the reload cost.
Build a repeatable performance routine
Add profiling to the release checklist for every major feature. Define the flows that must stay fast such as launch and feed scroll and search and checkout. Record baselines for those flows on a reference device and store the traces with the release notes. Set an internal budget for startup time and for scroll smoothness and for memory growth during a long session. Review any flow that breaks its budget before release rather than after users complain.
Share traces with the team instead of sharing opinions about speed. A trace file plus a short note about the steps lets another developer reproduce the finding. It also lets a reviewer check whether a proposed fix addresses the recorded block. Over time the team builds a library of known patterns and known fixes. That library shortens future investigations and keeps performance work visible in planning.
Performance work never ends with one good release. New features and new libraries and new system versions change the balance. Re-run the baseline suite after a major dependency update. Re-run it on a new system version before a wide rollout. A small regular routine beats a large emergency effort after a slow release reaches many users.
Reading traces like a professional
A trace tells a story when you read it from left to right. The timeline shows threads as horizontal lanes. The main thread lane deserves the first look because interface work lives there. A long block on that lane means the interface waited. Expand the block and read the method names inside it. The deepest method in the block often owns the cost. Follow that method upward to find the caller that triggered it. Fixing the caller sometimes helps more than optimising the method itself.
Compare traces across devices before declaring a fix complete. A method that runs fast on a flagship may run slowly on a budget device with a slower processor. A layout that measures quickly on a large screen may measure slowly on a small screen with different density. Record the same flow on two device classes and compare the hot methods. A fix that helps both classes is a real fix. A fix that helps only one class may hide a device specific problem.
Keep a personal library of trace patterns. A repeating stripe pattern means repeated work per frame. A single tall block means one heavy operation. A gap on the main thread means waiting for another thread or for input. A sawtooth memory graph means frequent allocation and collection. Naming patterns speeds future work because recognition replaces fresh analysis. Share the library with the team so everyone reads traces with the same vocabulary.
Review traces in code review for performance sensitive changes. A pull request that adds a new list screen should include a trace for scrolling that list. A pull request that adds a startup task should include a trace for cold launch. Evidence in review prevents slow code from merging quietly. Over time the team treats performance evidence as normal review material rather than as extra work.

